Feature group · Benchmarks
Comparable, verified results you can trust
Your engagement scores need context. Is 76 good or concerning? Without benchmarks, you are guessing. Compare your teams internally and against thousands of companies in your industry, so you finally know where you stand and can set realistic targets executives will support.
What's inside
10 features making it real.
01
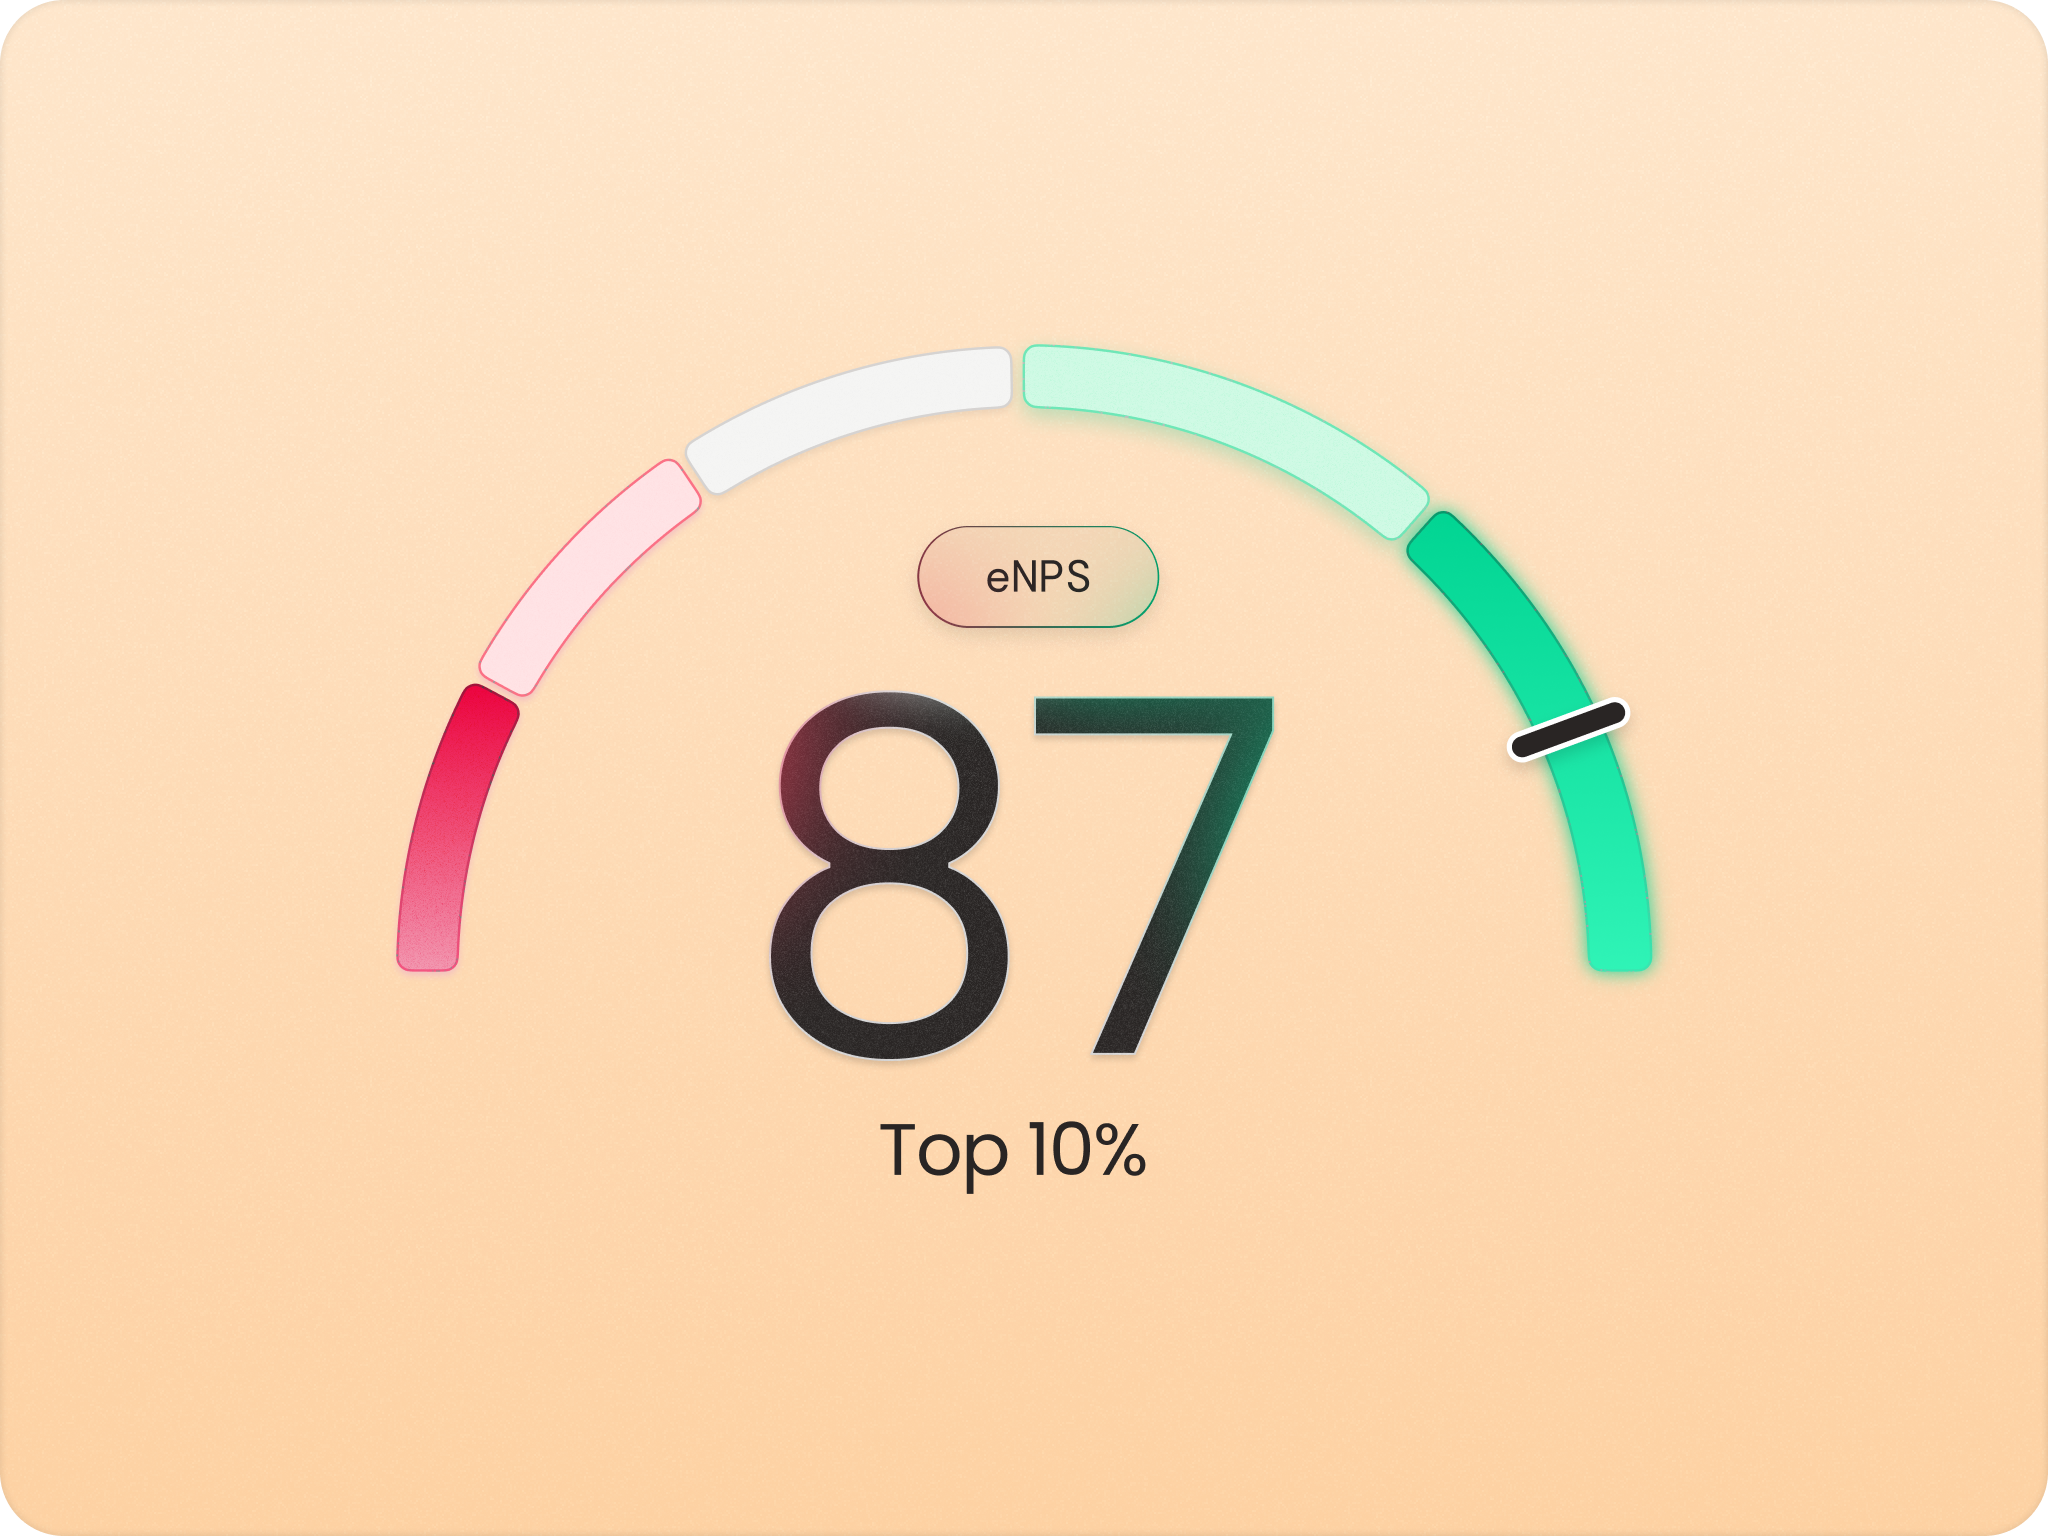
See how you stack up against your industry
Zoios provides industry benchmark data from thousands of companies so you can understand how your engagement compares to similar organisations. You see whether you rank in the top 10%, top 25% or below average for well-being and eNPS. External benchmarking adds perspective beyond internal comparison, helping you set realistic targets and understand whether your challenges are unique or industry-wide.
02
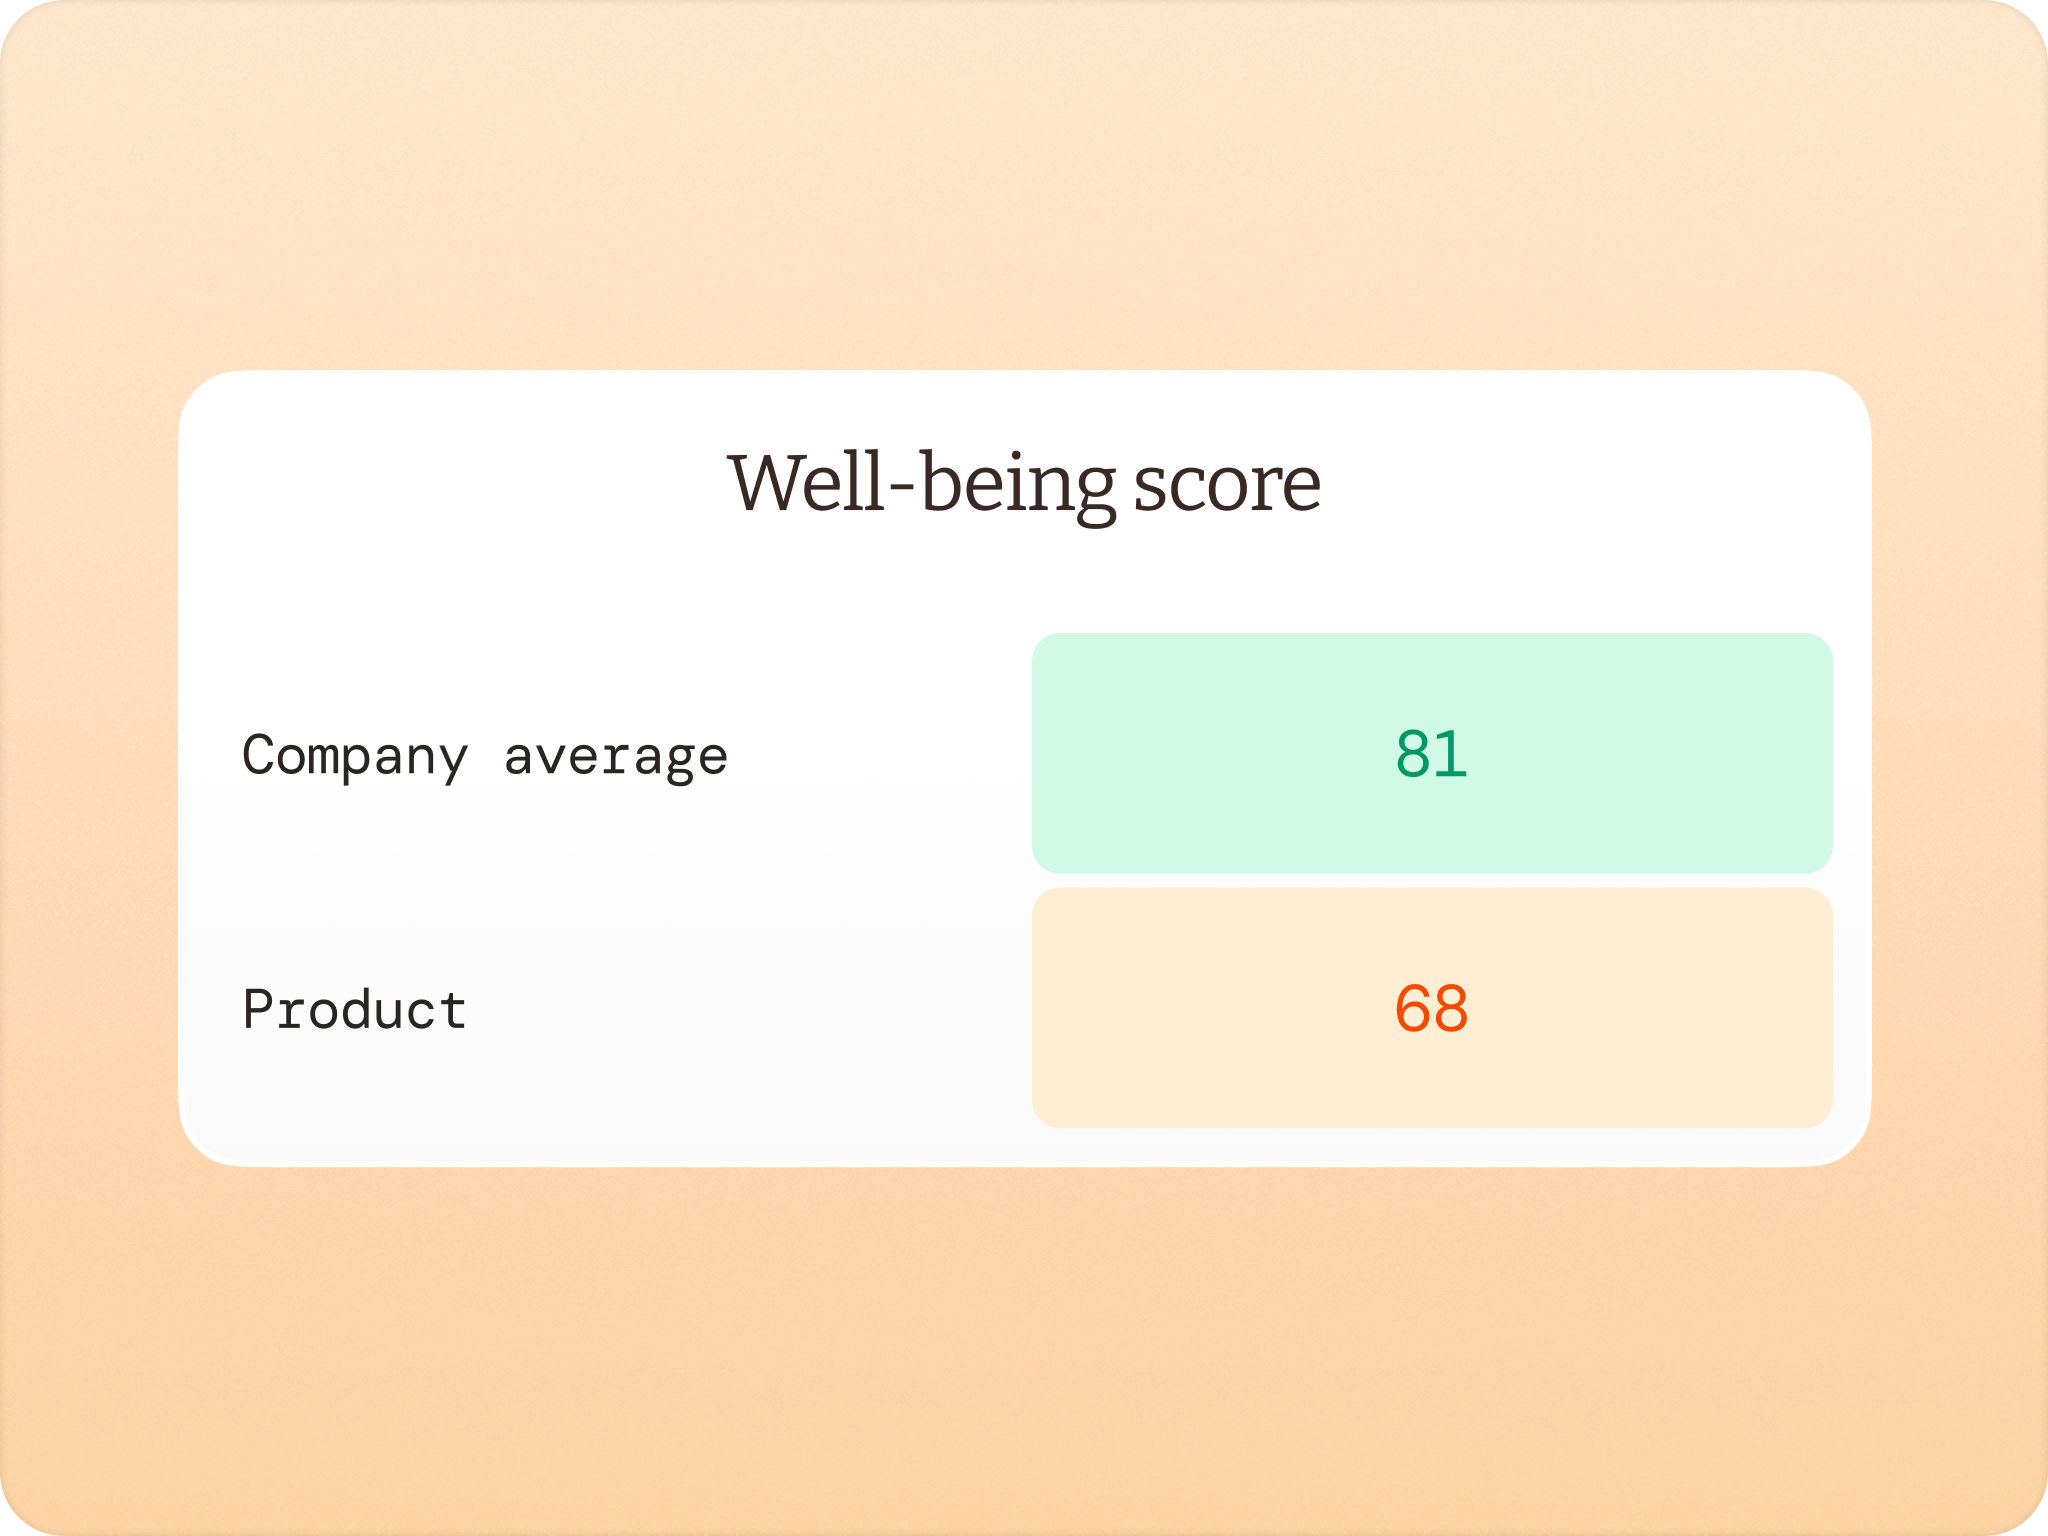
Compare your teams against your company average
Zoios lets you benchmark any team or department against your overall company scores so you can identify where engagement is thriving and where it needs attention. Every segment shows how its well-being, strain and eNPS compare to the organisational average, making it easy to spot outliers and prioritise leadership conversations. This internal comparison helps managers understand their team's relative performance and creates healthy accountability across the organisation.
03
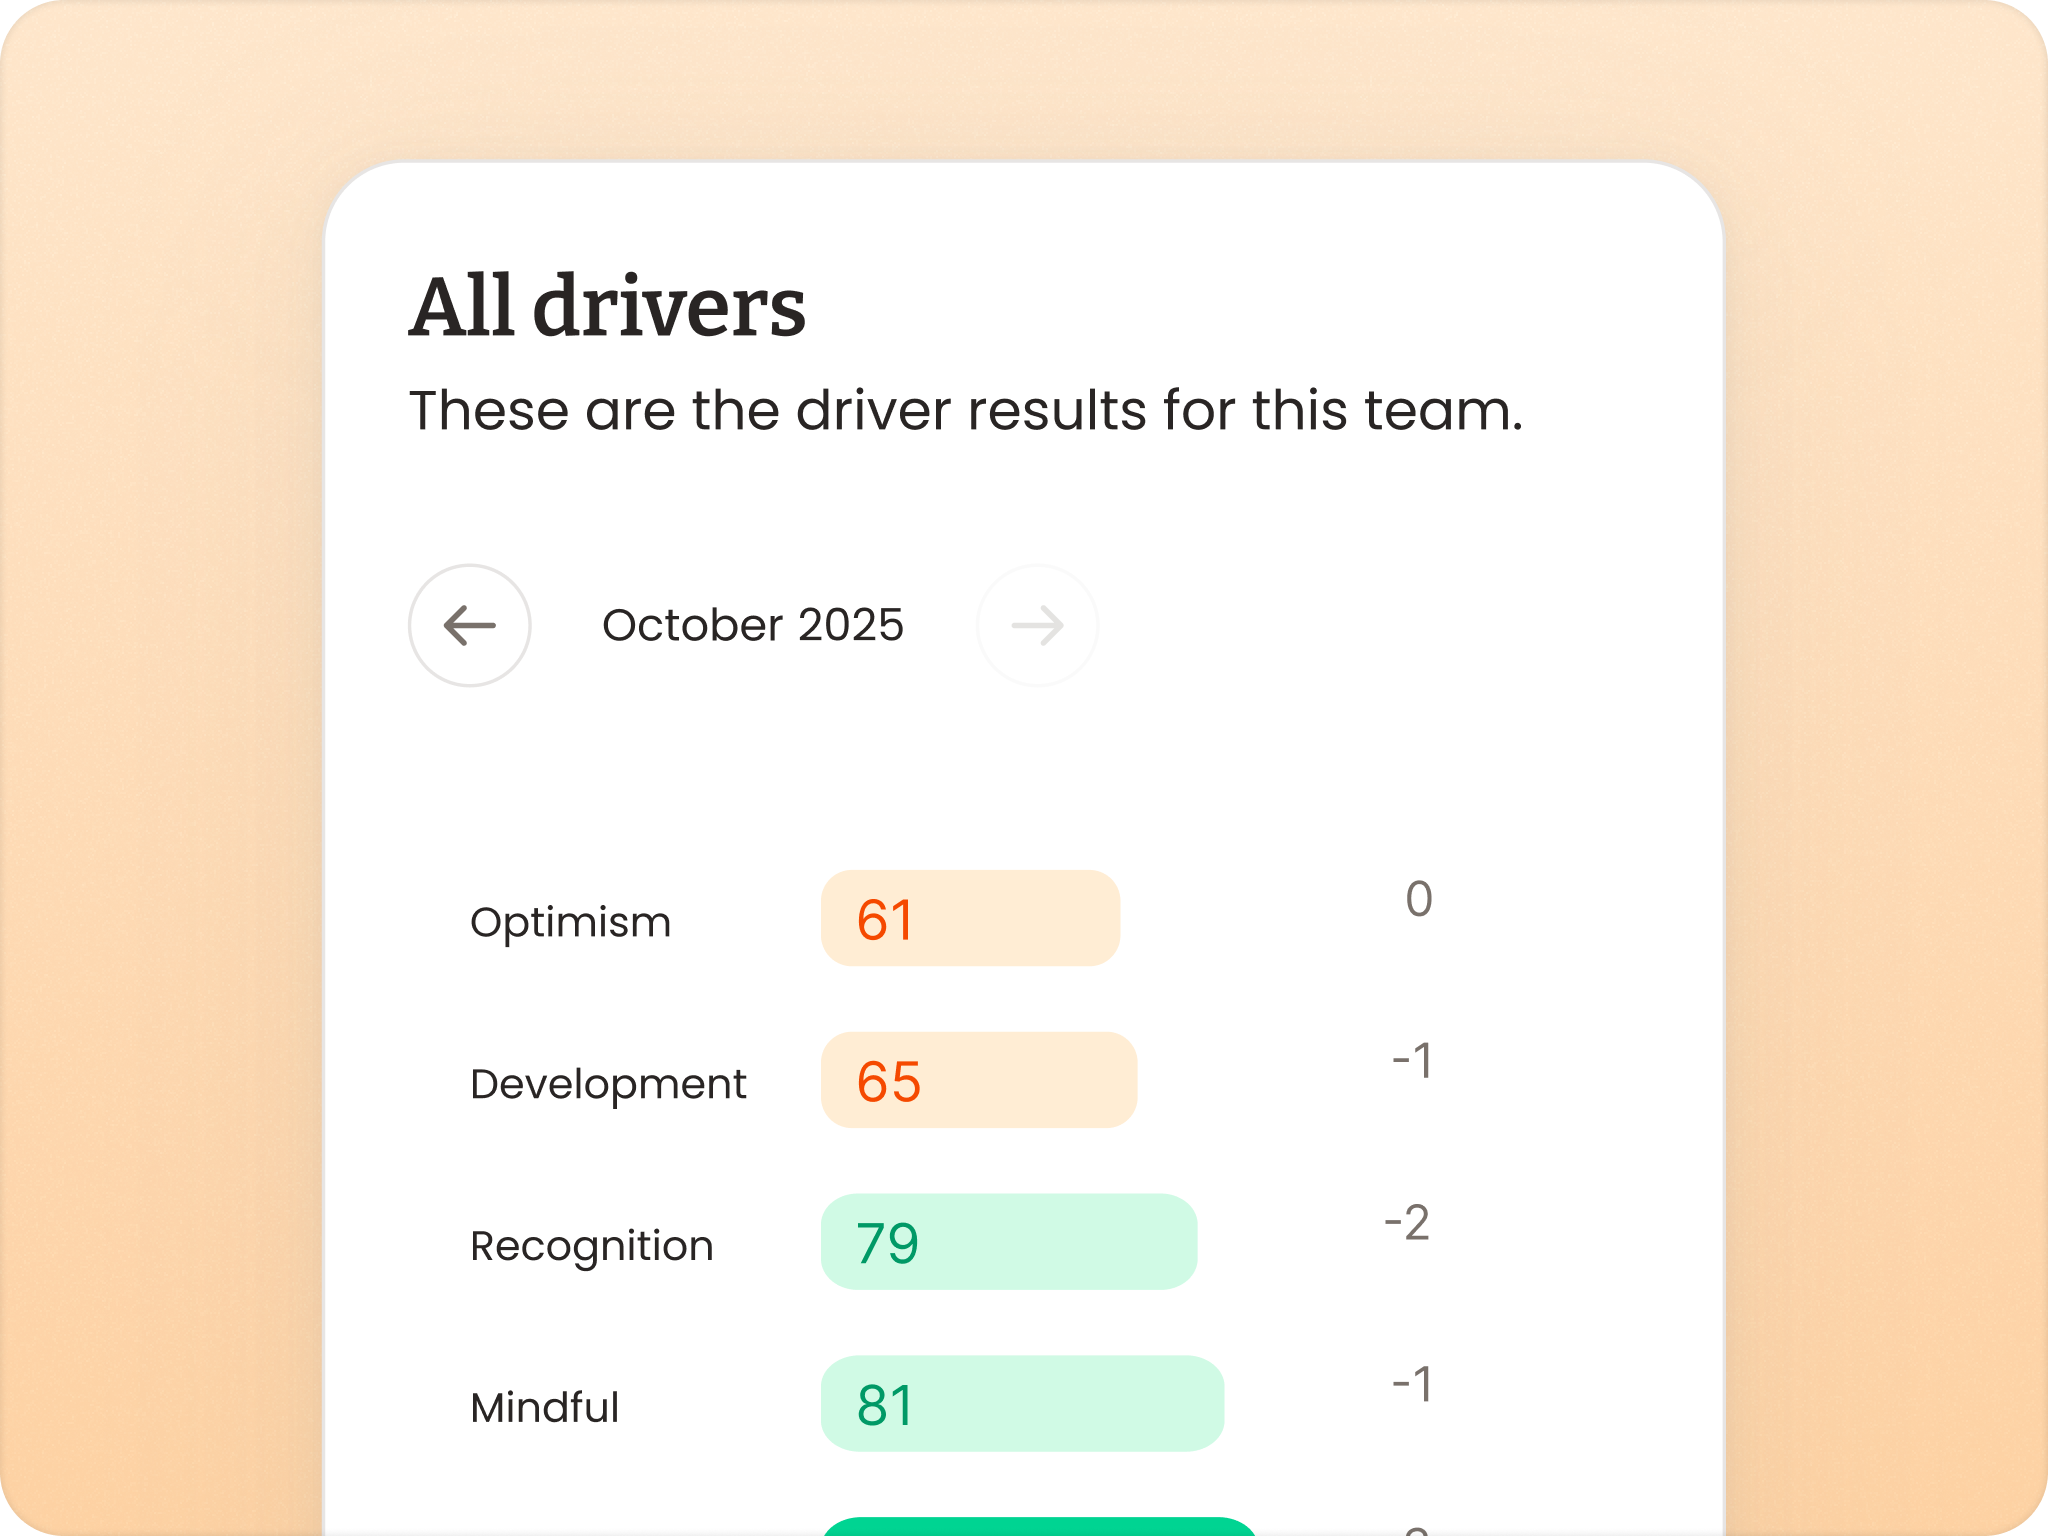
Measure the factors that actually determine employee satisfaction
Zoios tracks the eight drivers that research shows truly impact job satisfaction: life harmony, development, social relationships, support, recognition, mindfulness, contribution and optimism. Each driver gets its own score from 0 to 100, showing you the specific levers you can pull. This granular view moves you beyond a generic engagement score to understand exactly what's working and what's broken, like discovering your team loves their work but feels under-appreciated.
04
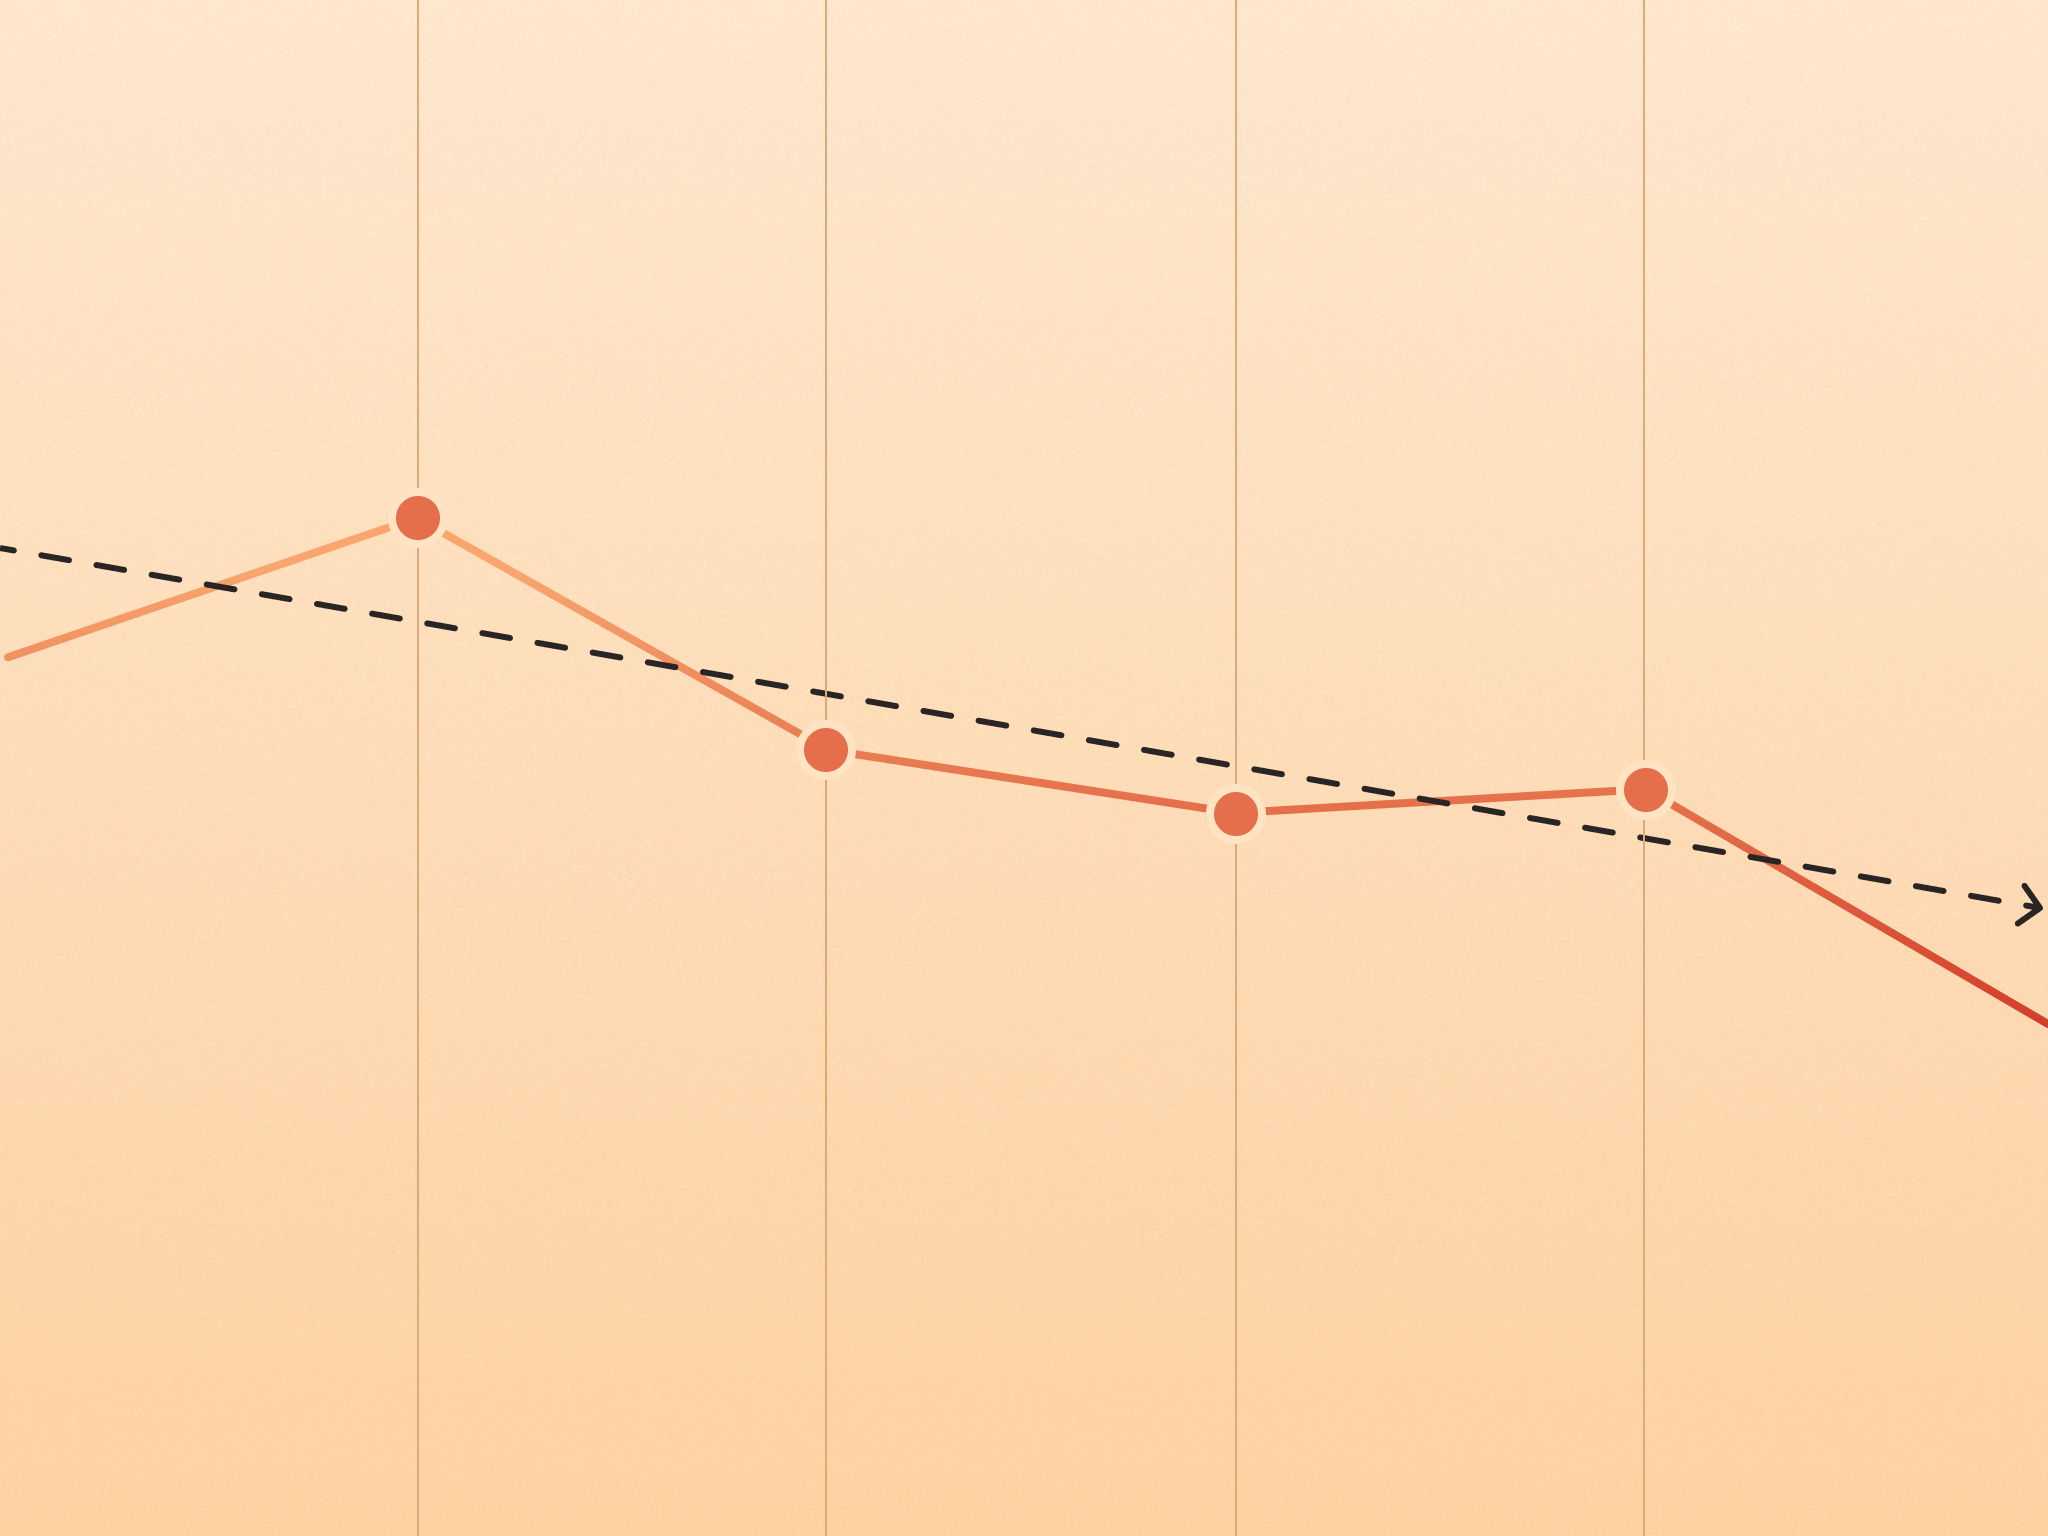
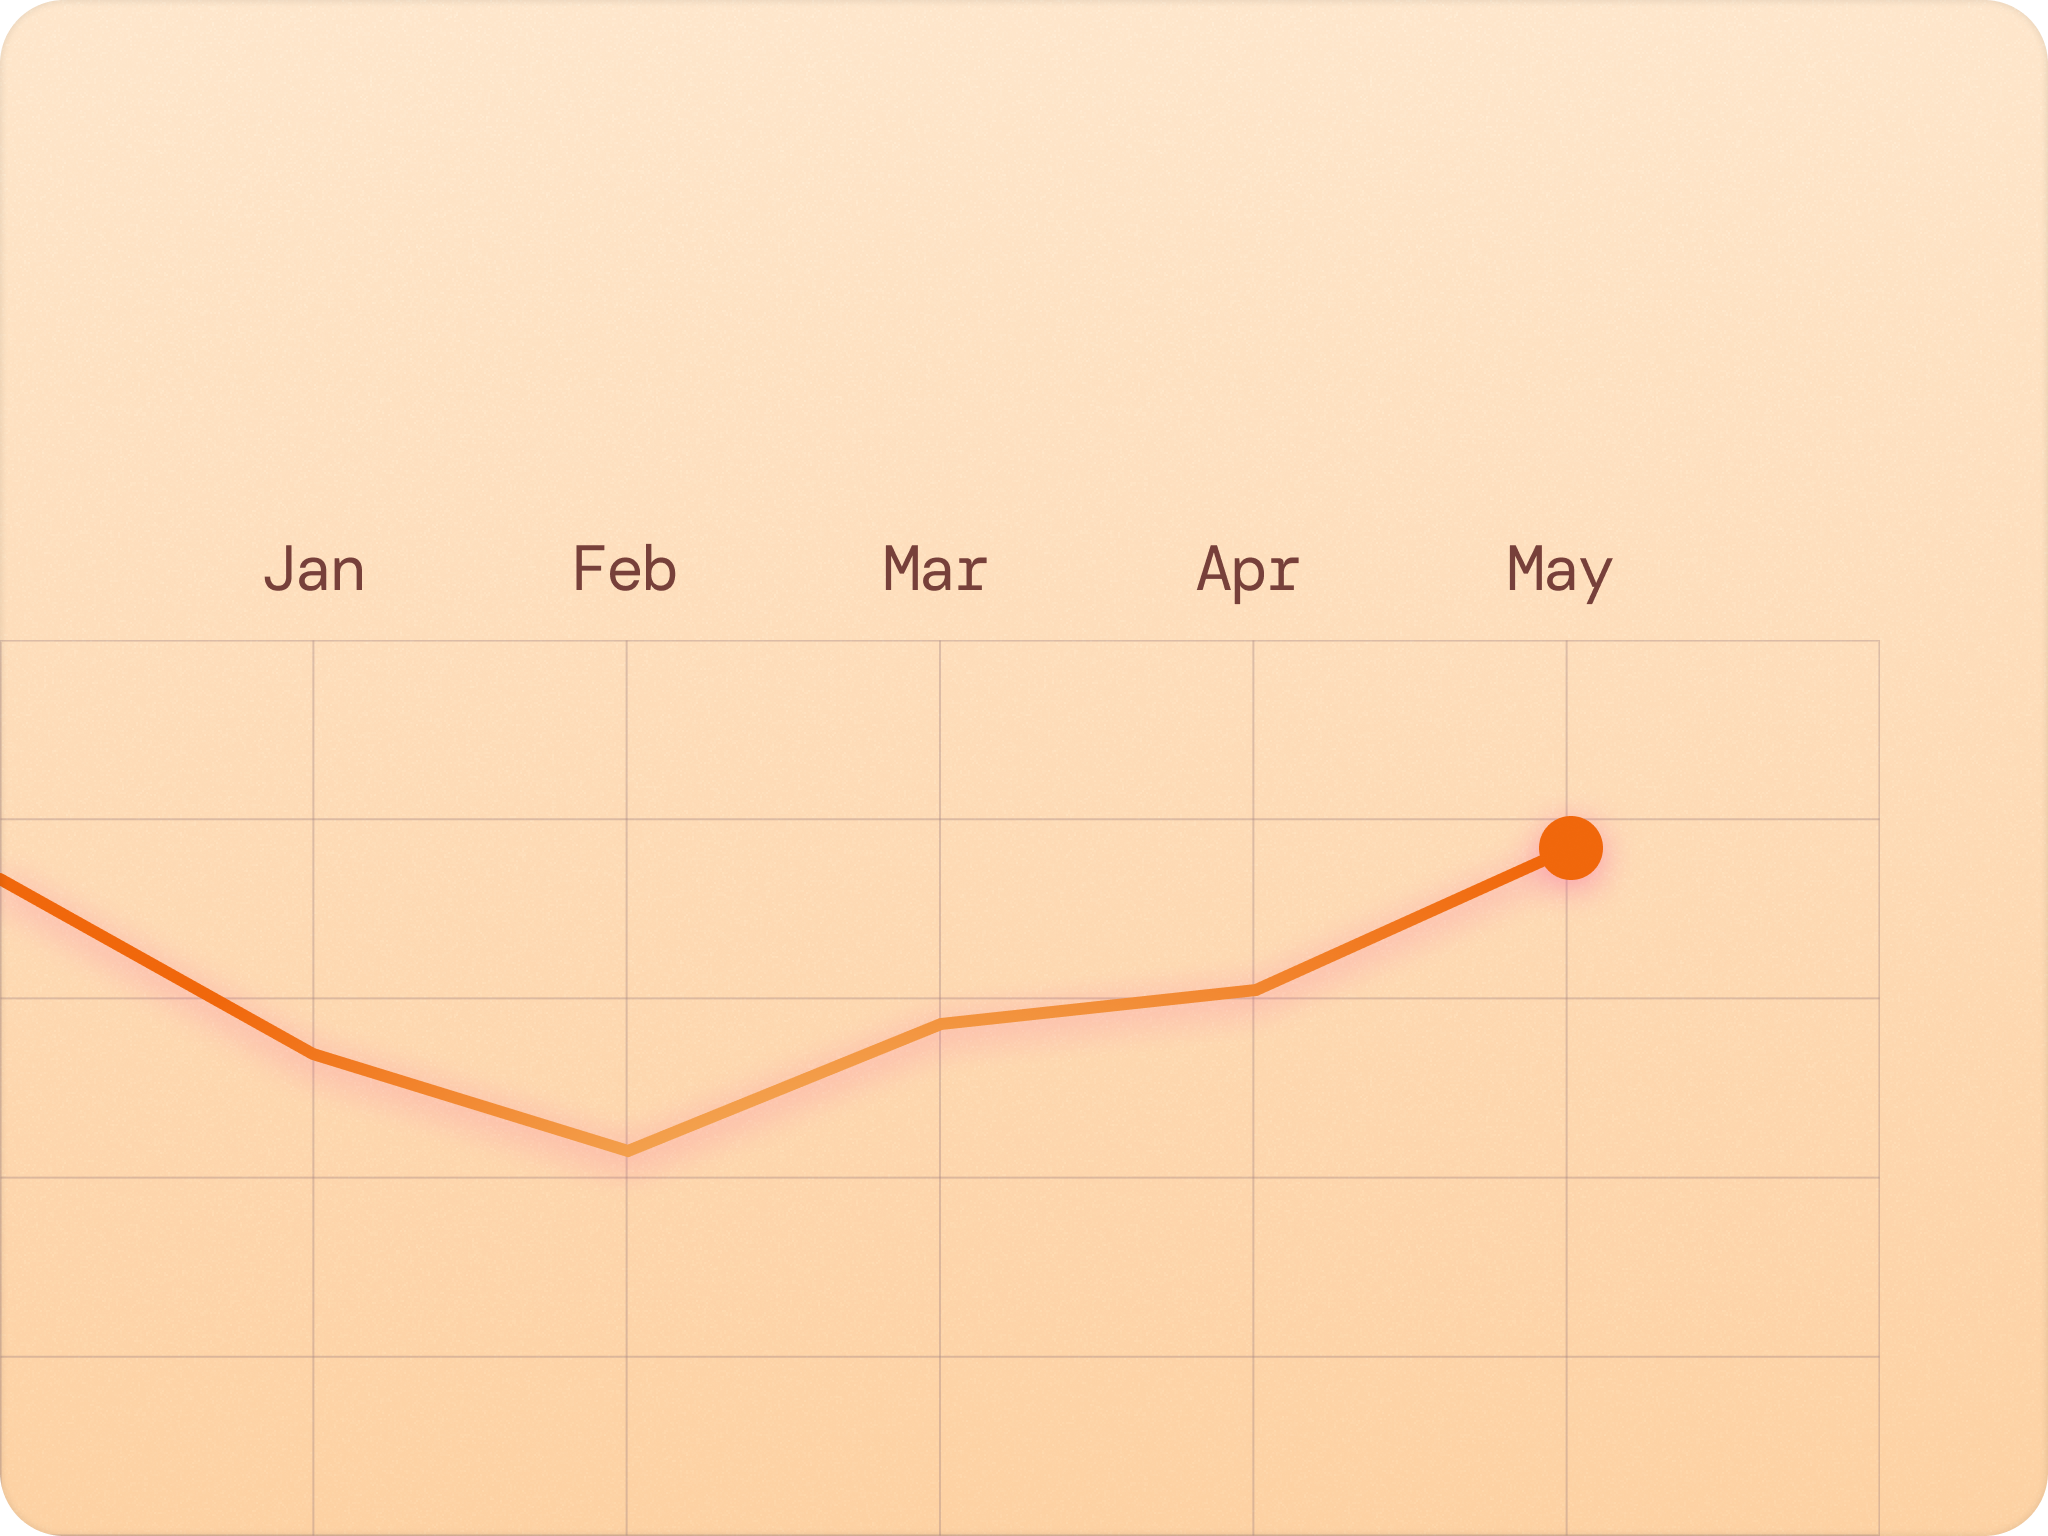
Catch engagement shifts before they become problems
Zoios tracks engagement metrics over time and highlights significant trends in company or team scores, helping you spot deteriorating well-being early. The platform shows whether scores are improving, declining or stable, with visual indicators that draw attention to meaningful change. By surfacing trends automatically, you can be proactive about engagement issues rather than reactive, intervening when scores start to slip instead of waiting until you have a real problem.
05
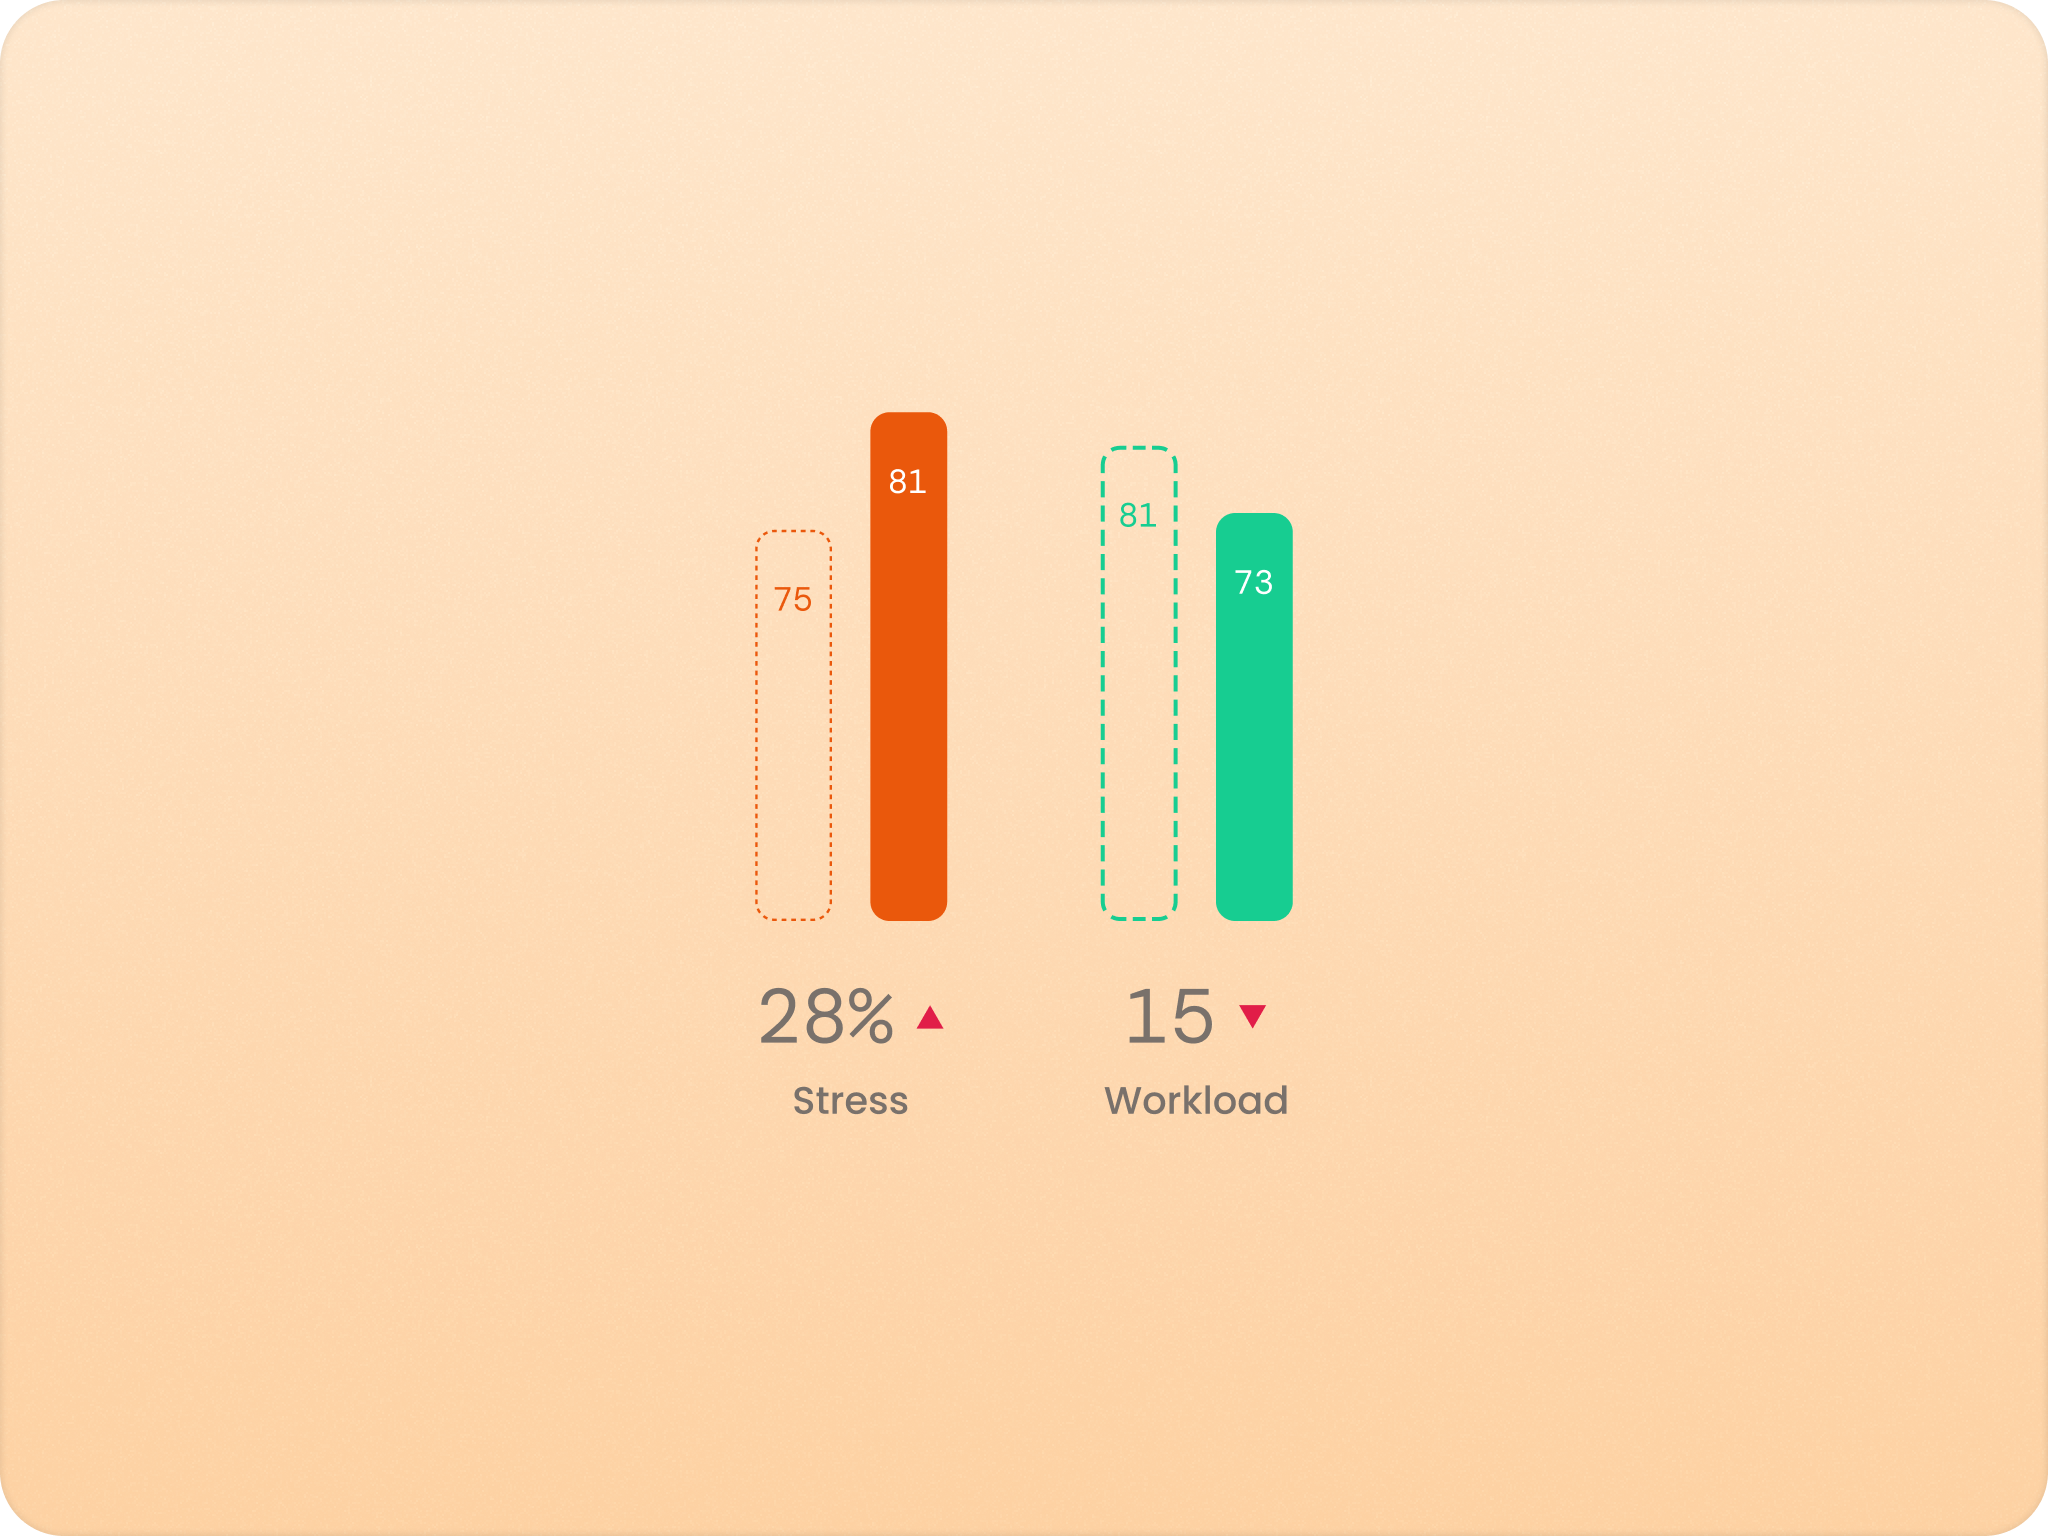
Understand whether stress comes from work volume or other factors
Zoios provides a workload-versus-strain chart that reveals whether team stress is driven by volume or by other complications like complexity, unclear expectations or personal issues. You see teams with high strain but low workload (pointing to non-volume issues) or high workload without strain (showing people are coping). The analysis prevents the common mistake of reducing workload when the real problem is poor collaboration or unclear priorities, and helps you target the right solution.
06
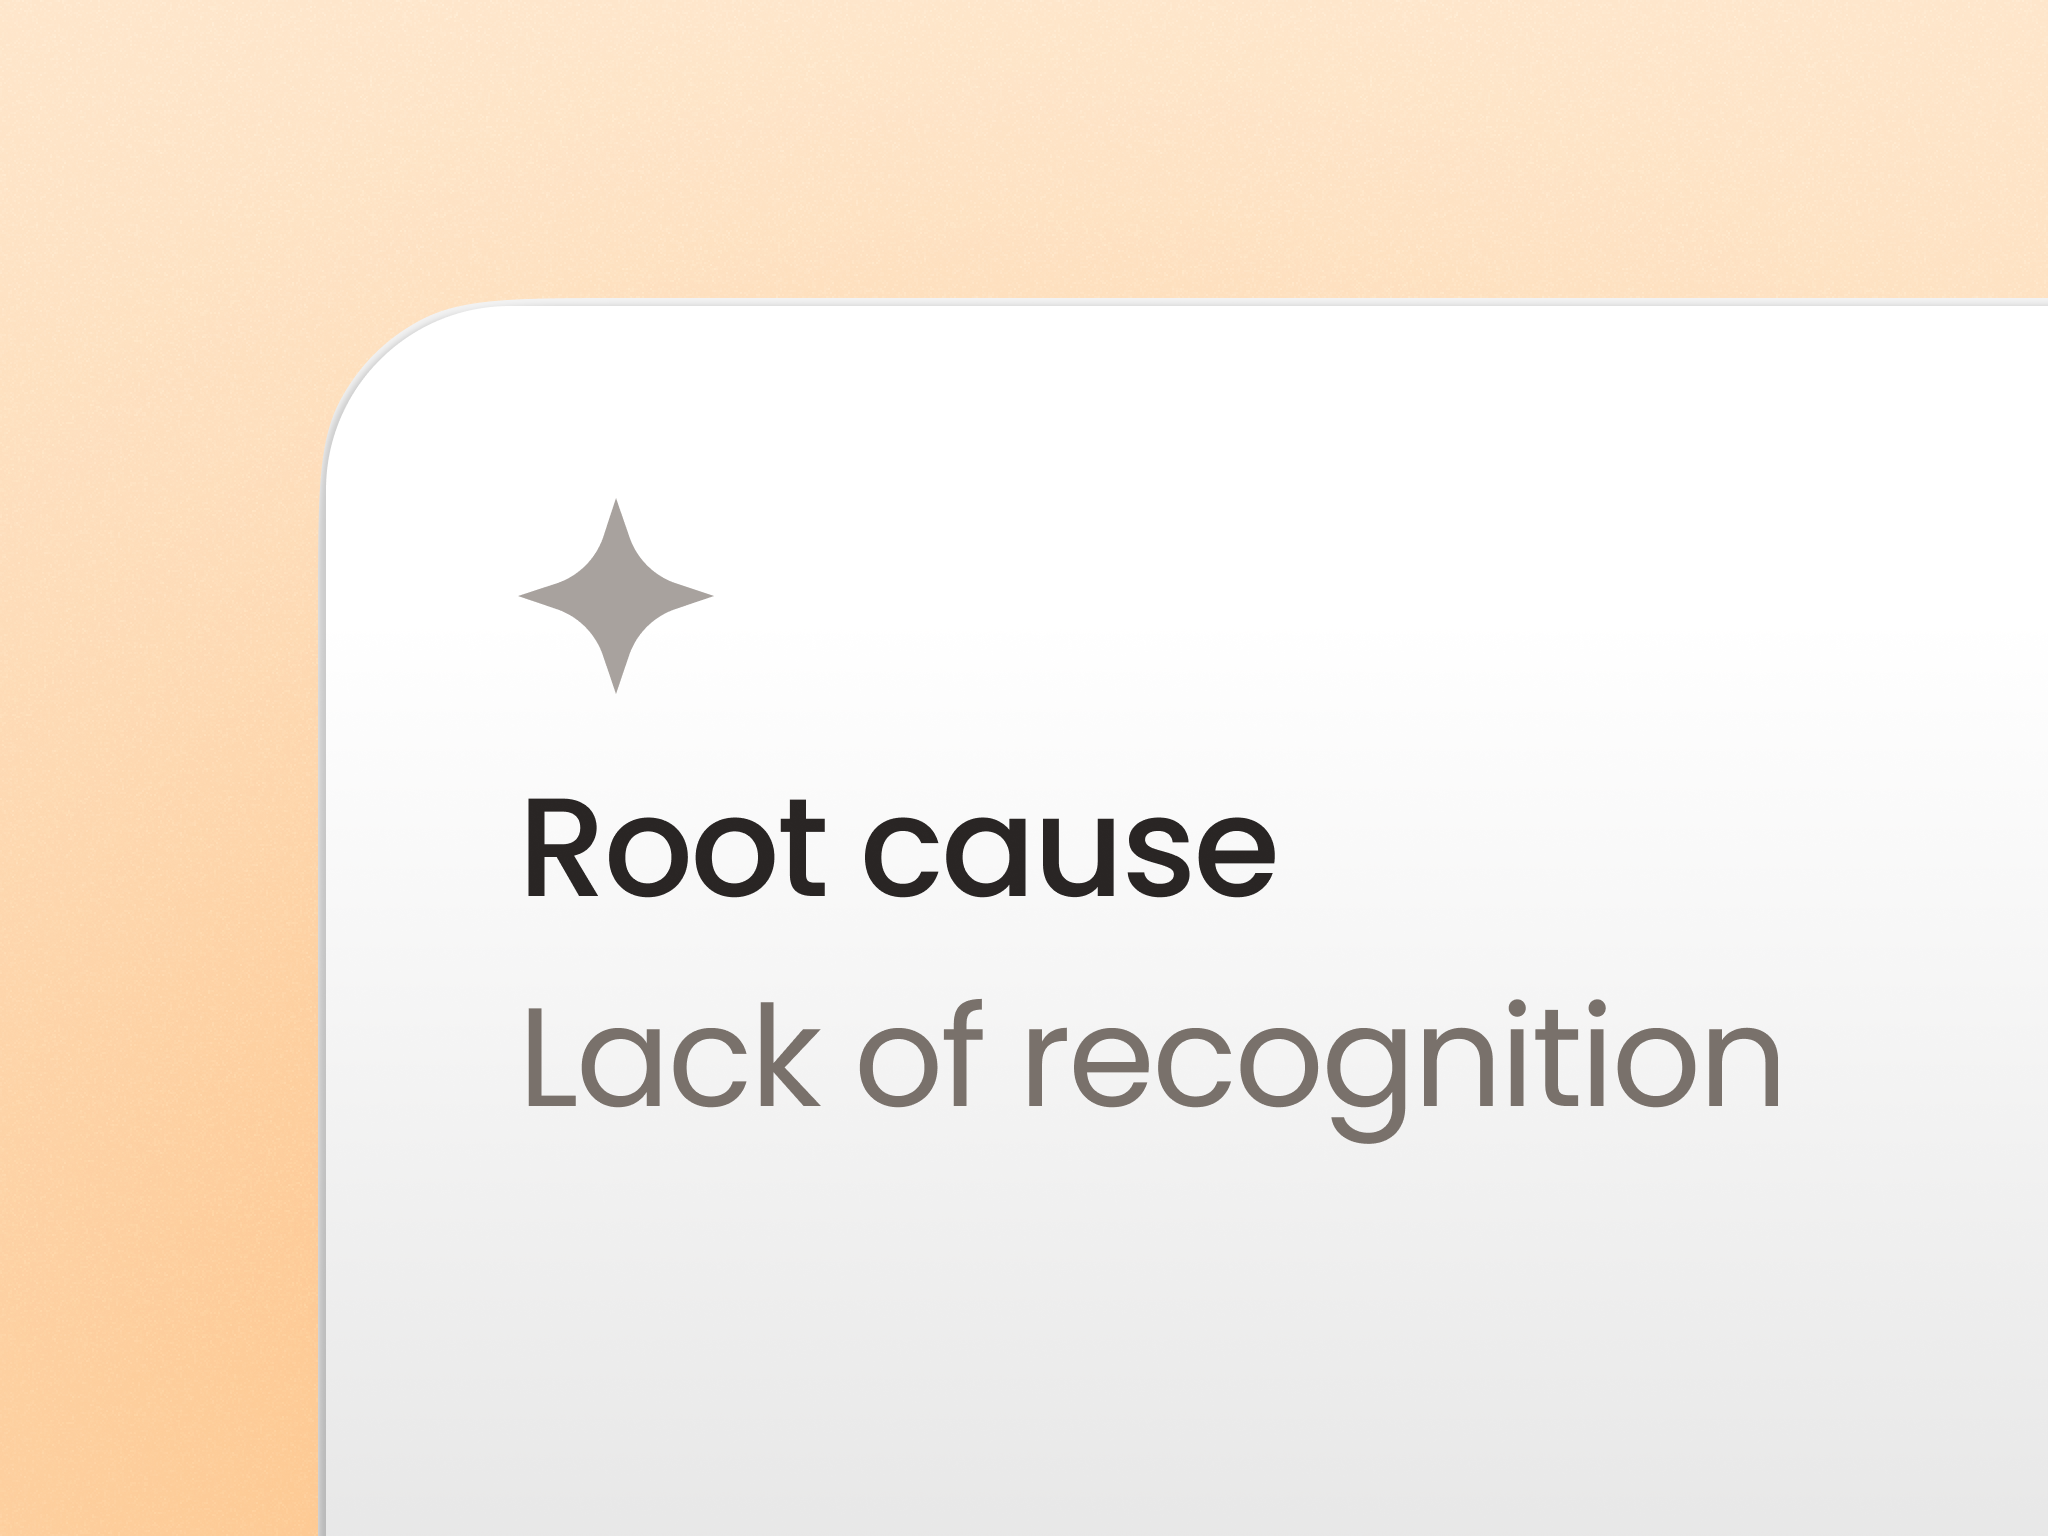
Uncover the real drivers behind your engagement challenges
Zoios uses AI to analyse engagement patterns across your data and identify the underlying causes of well-being issues. Instead of just showing low scores, it examines relationships between drivers, comments and segments to surface insights like 'Recognition is the biggest lever for improving well-being in your Sales team.' This holistic analysis helps you move beyond surface-level observations to understand what's really affecting your people, and where to focus.
07
Compare engagement across seniority levels and tenure groups
Zoios provides segmentation by cross-organisational attributes like job level, tenure bands and role types that span multiple teams. You can see how well-being differs between senior leaders and junior staff, or compare new hires in their first six months with people at two-plus years tenure. These cross-cutting segments reveal patterns that pure organisational segmentation misses, such as whether your engagement challenge is actually a new-hire onboarding issue.
08
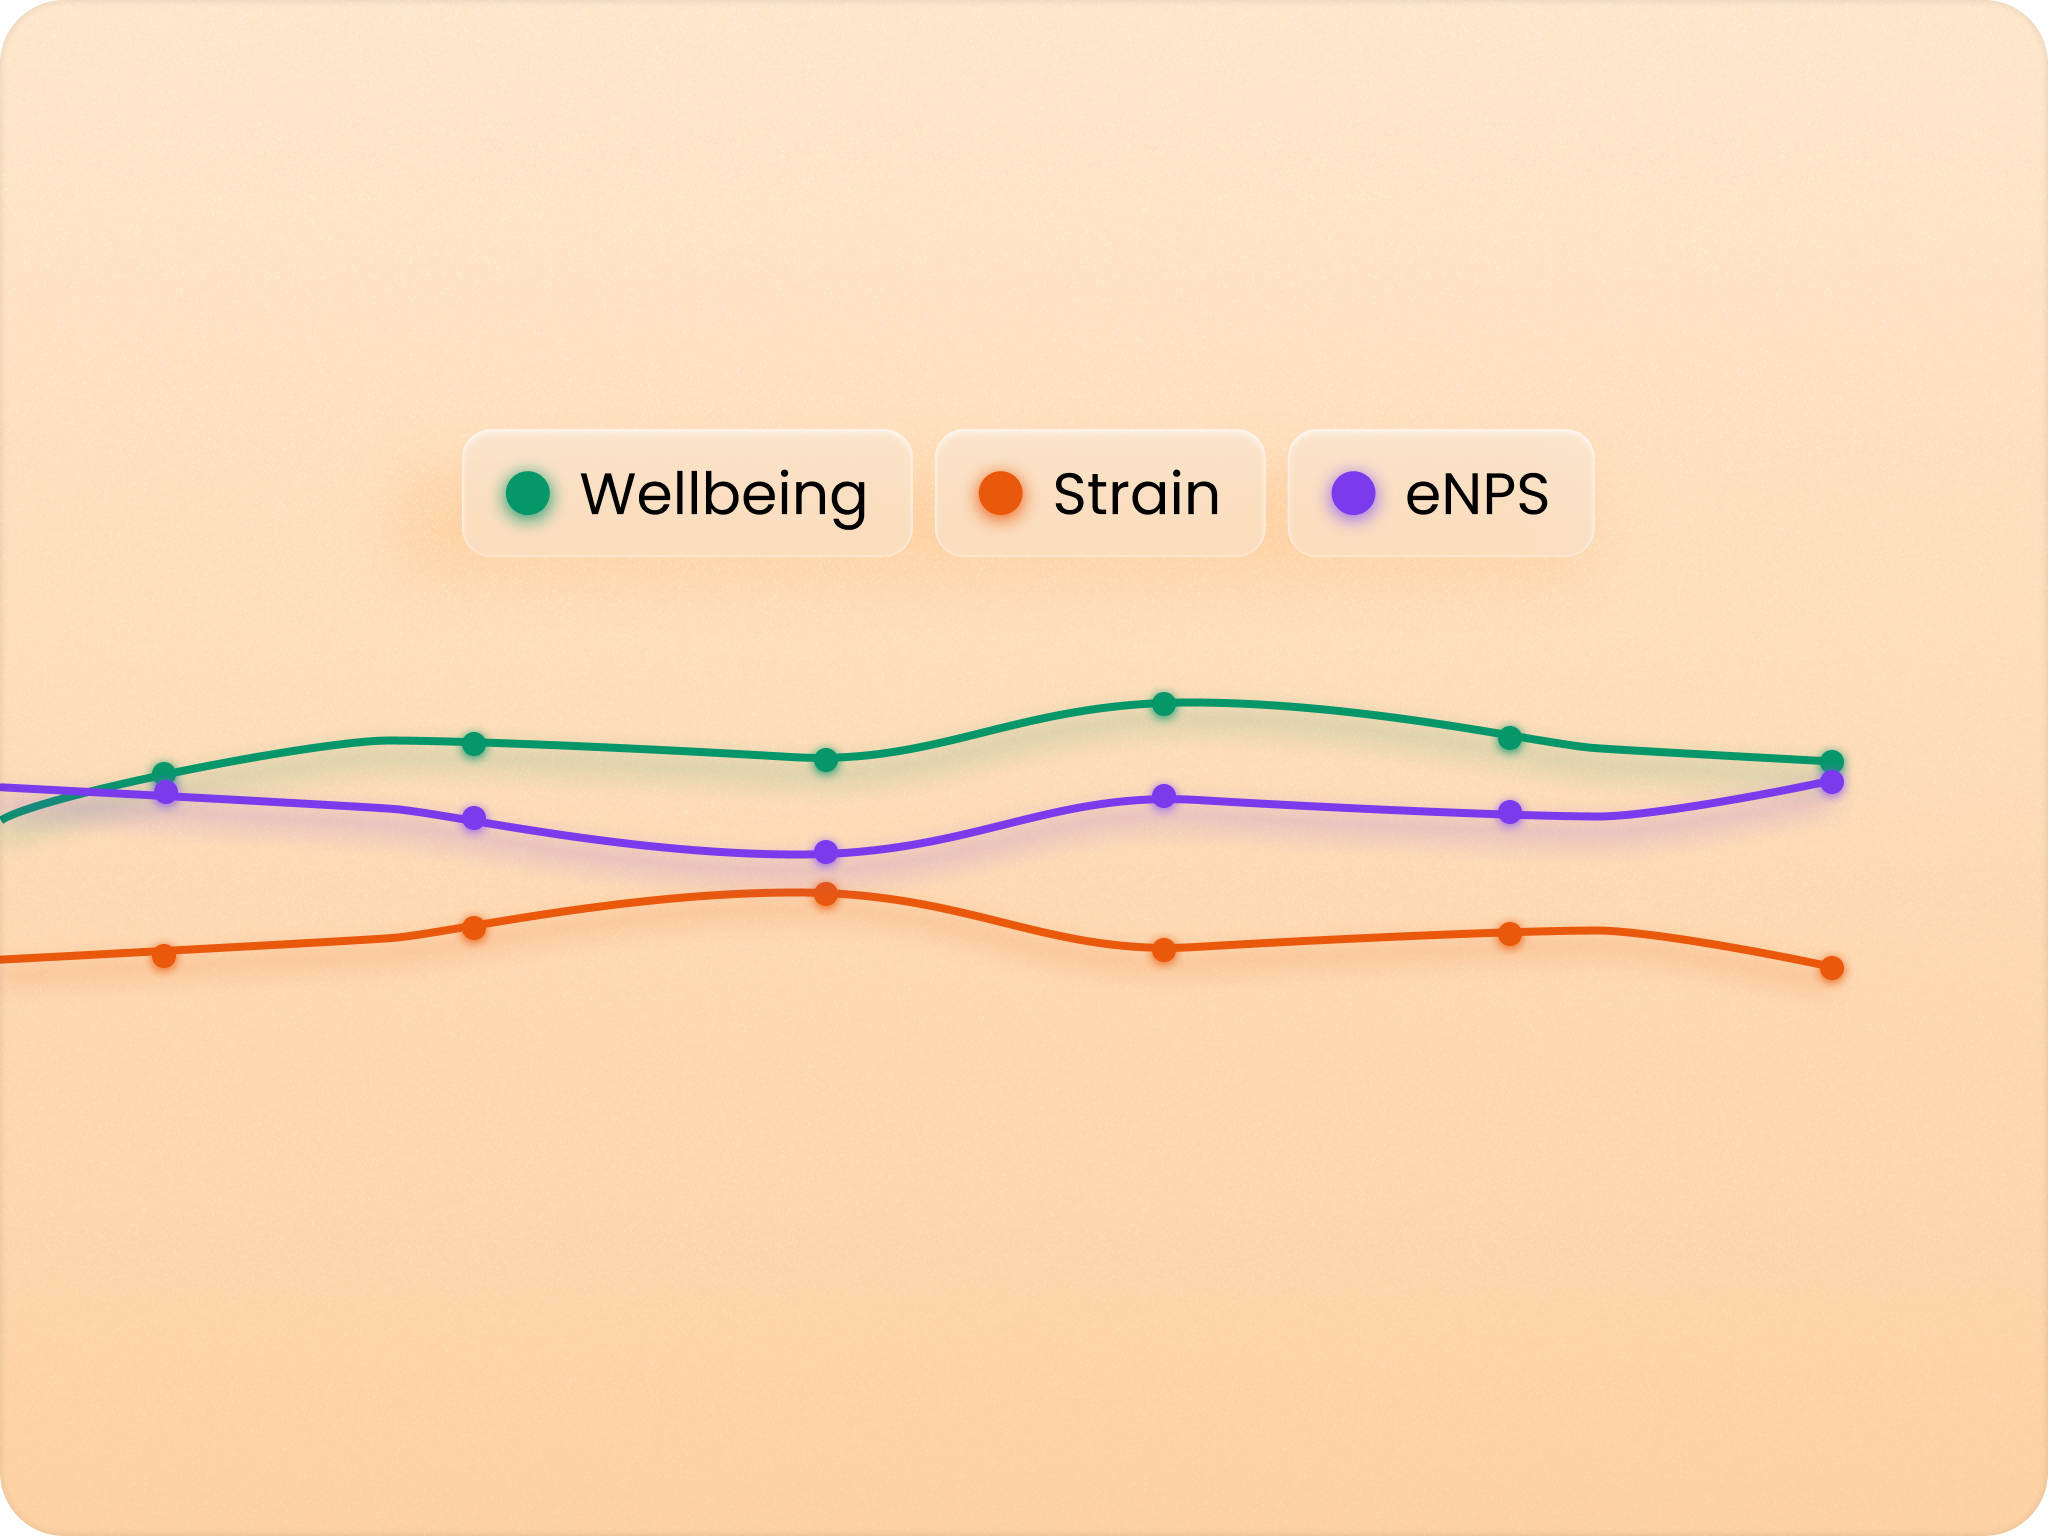
Track how specific engagement factors evolve across months
Zoios shows each well-being driver's score over time so you can see whether recognition, development or other factors are improving or declining across periods. The trend lines help you assess whether initiatives are working, like checking if your new performance-review process actually lifted development scores. By tracking individual drivers rather than a single overall score, you understand the components of your engagement story and can measure the impact of targeted interventions.
09
Get real-time engagement insights the moment surveys close
Zoios generates live dashboards and visualisations the instant employees complete the pulse survey, no waiting for manual analysis or report compilation. HR and managers see up-to-date well-being scores, trends and comments in real time without touching Excel or building presentations. Immediate access means you can respond to engagement issues quickly and make data-driven decisions without delay.
10
See company-wide engagement health at a glance
Zoios provides immediate organisational-level insight, showing overall well-being, strain and eNPS across the company the moment responses come in. The dashboard highlights your strongest and weakest drivers, response rate and a comparison with previous measurements, with no manual calculation. The instant company view helps executives and HR quickly assess organisational health and identify the biggest opportunities for cultural improvement.
Your engagement scores only tell half the story without context. Is a well-being score of 76 good or concerning? Should you celebrate an eNPS of 28 or worry about it? Without benchmarks, you are flying blind, making it nearly impossible to set realistic goals or justify people investments to leadership.
Zoios gives you two critical layers of comparison. Compare teams internally to spot which departments are thriving and which need immediate support. Then benchmark against thousands of companies in your industry to understand whether your challenges are unique or widespread. This dual perspective transforms raw numbers into actionable intelligence.
The best part? These are not arbitrary thresholds we invented. Our interpretation levels are informed by millions of employee data points and linked to real outcomes like turnover and sick leave. When Zoios tells you a score is a 'challenge' versus a 'concern,' you can trust that assessment because it is grounded in what actually predicts workplace problems.
Stop guessing whether your engagement scores are good enough. With proper benchmarking, you will know exactly where you stand, can set ambitious but achievable targets, and finally have the data to convince executives that your people strategy deserves investment. Your HR initiatives should not be shots in the dark, they should be informed by what great actually looks like.
Want to see it in action?
Set up your first measurement in minutes.
Zoios is free to get going. Try it with your team or talk to a human first, your call.