Feature group · Spot trends
Catch engagement shifts before they become problems
Single data points tell you where you are, but trends tell you where you are heading. Without tracking engagement over time, you cannot tell if problems are getting better or worse, whether your initiatives actually work, or catch deteriorating well-being before it becomes a crisis.
What's inside
7 features making it real.
01
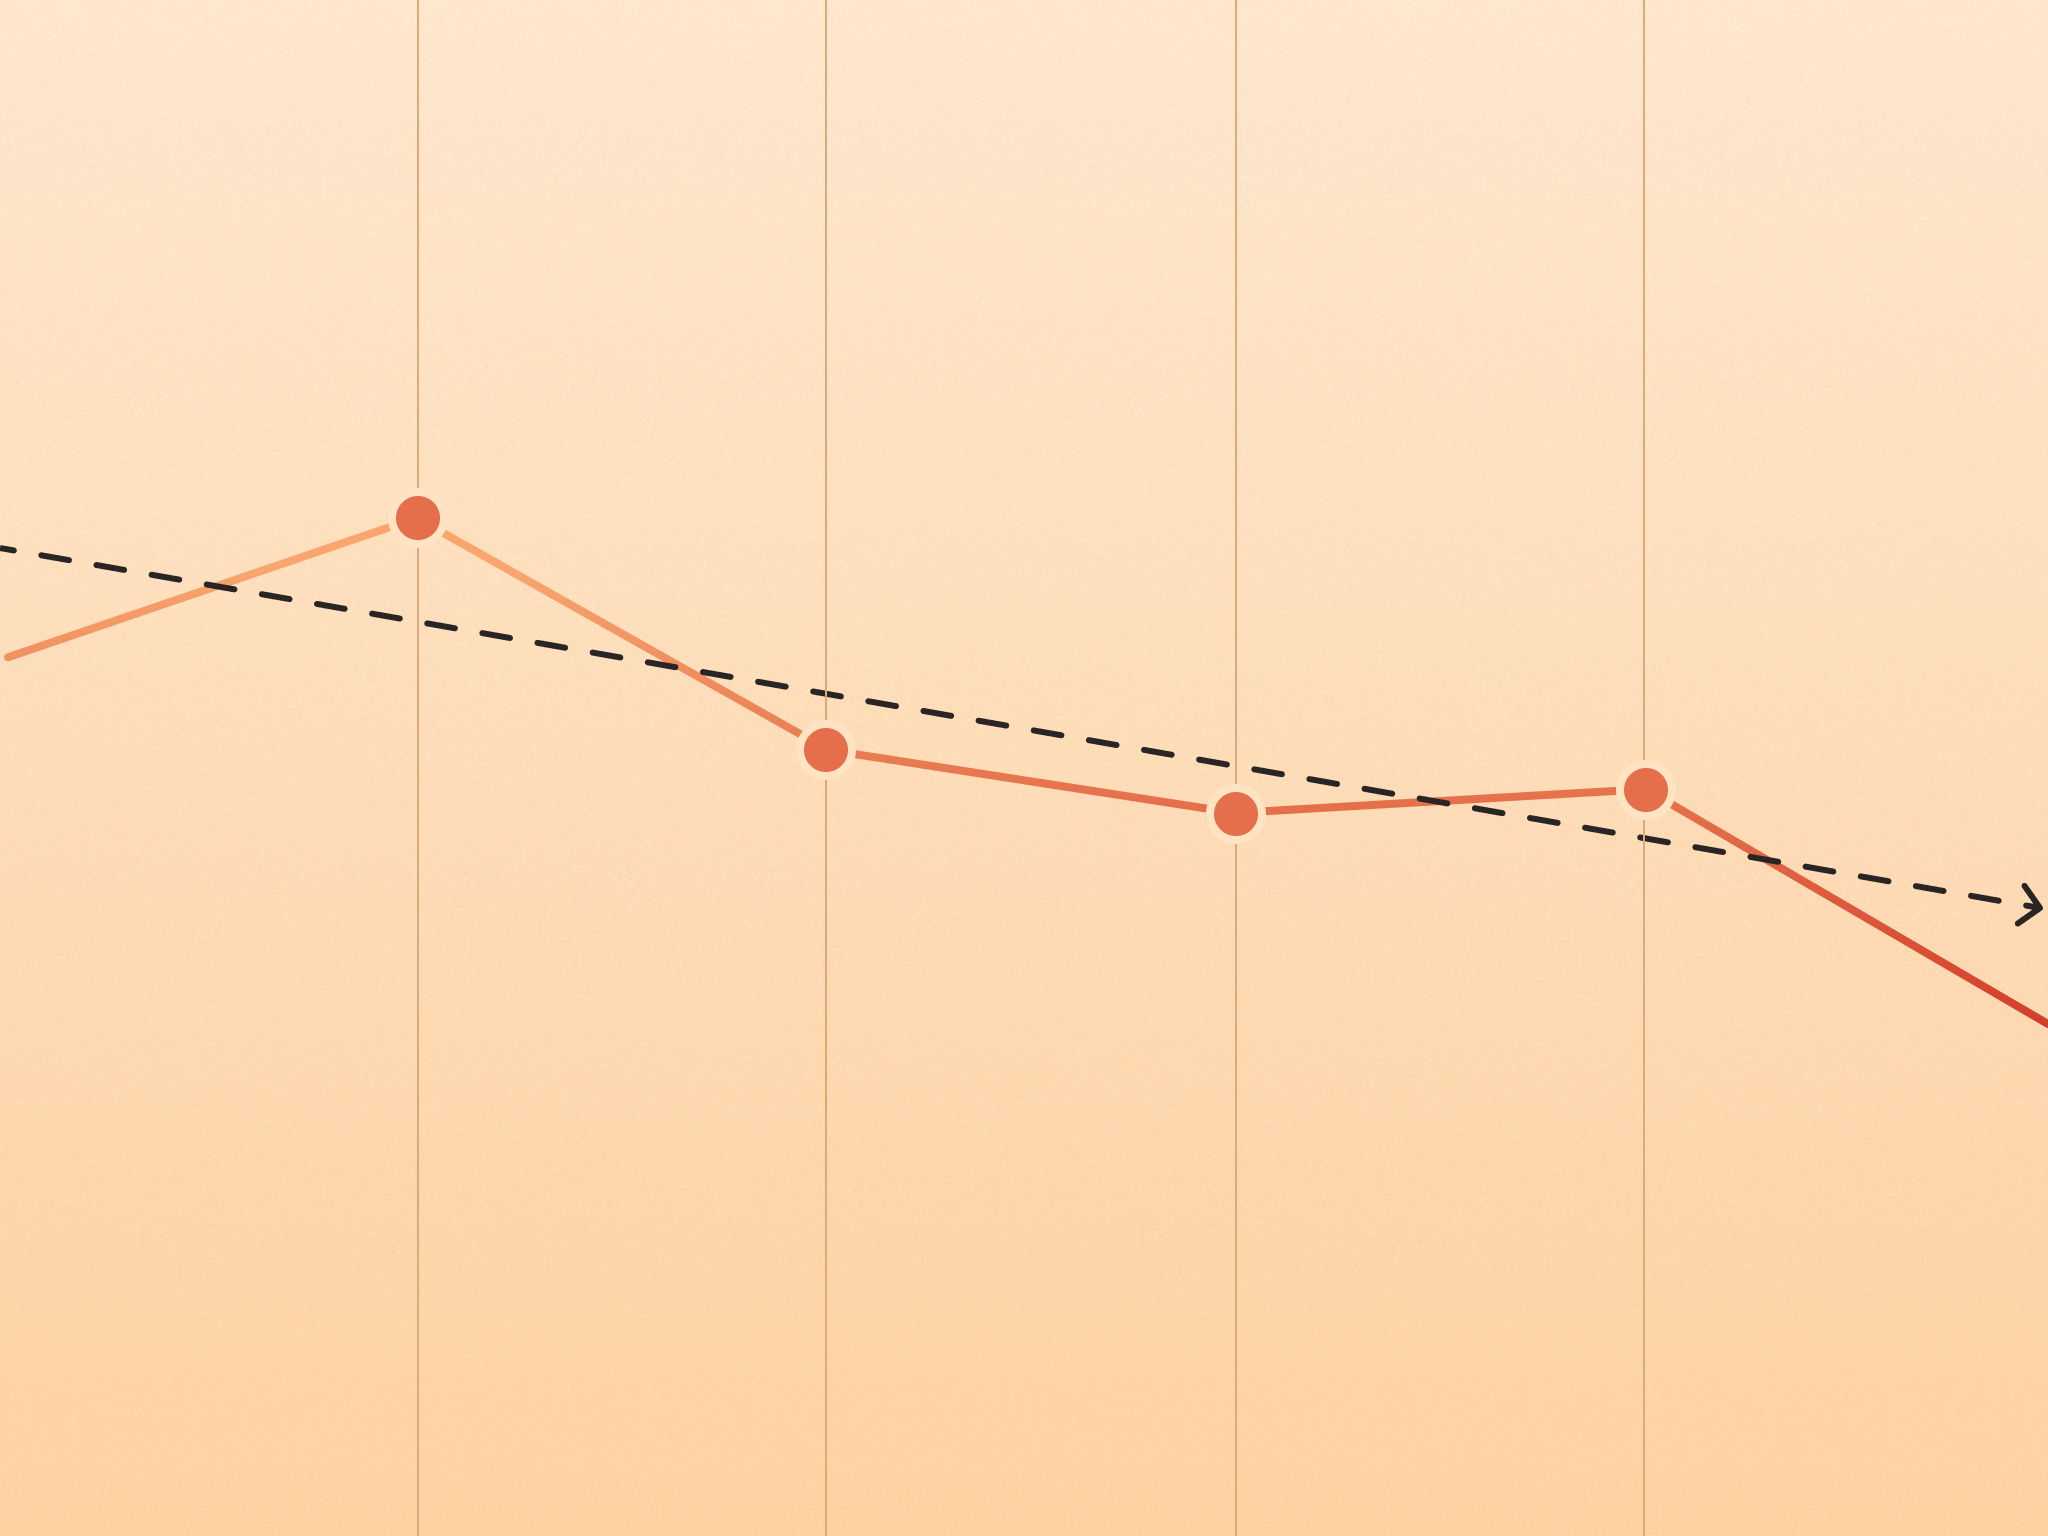
Catch engagement shifts before they become problems
Zoios tracks engagement metrics over time and highlights significant trends in company or team scores, helping you spot deteriorating well-being early. The platform shows whether scores are improving, declining or stable, with visual indicators that draw attention to meaningful change. By surfacing trends automatically, you can be proactive about engagement issues rather than reactive, intervening when scores start to slip instead of waiting until you have a real problem.
02
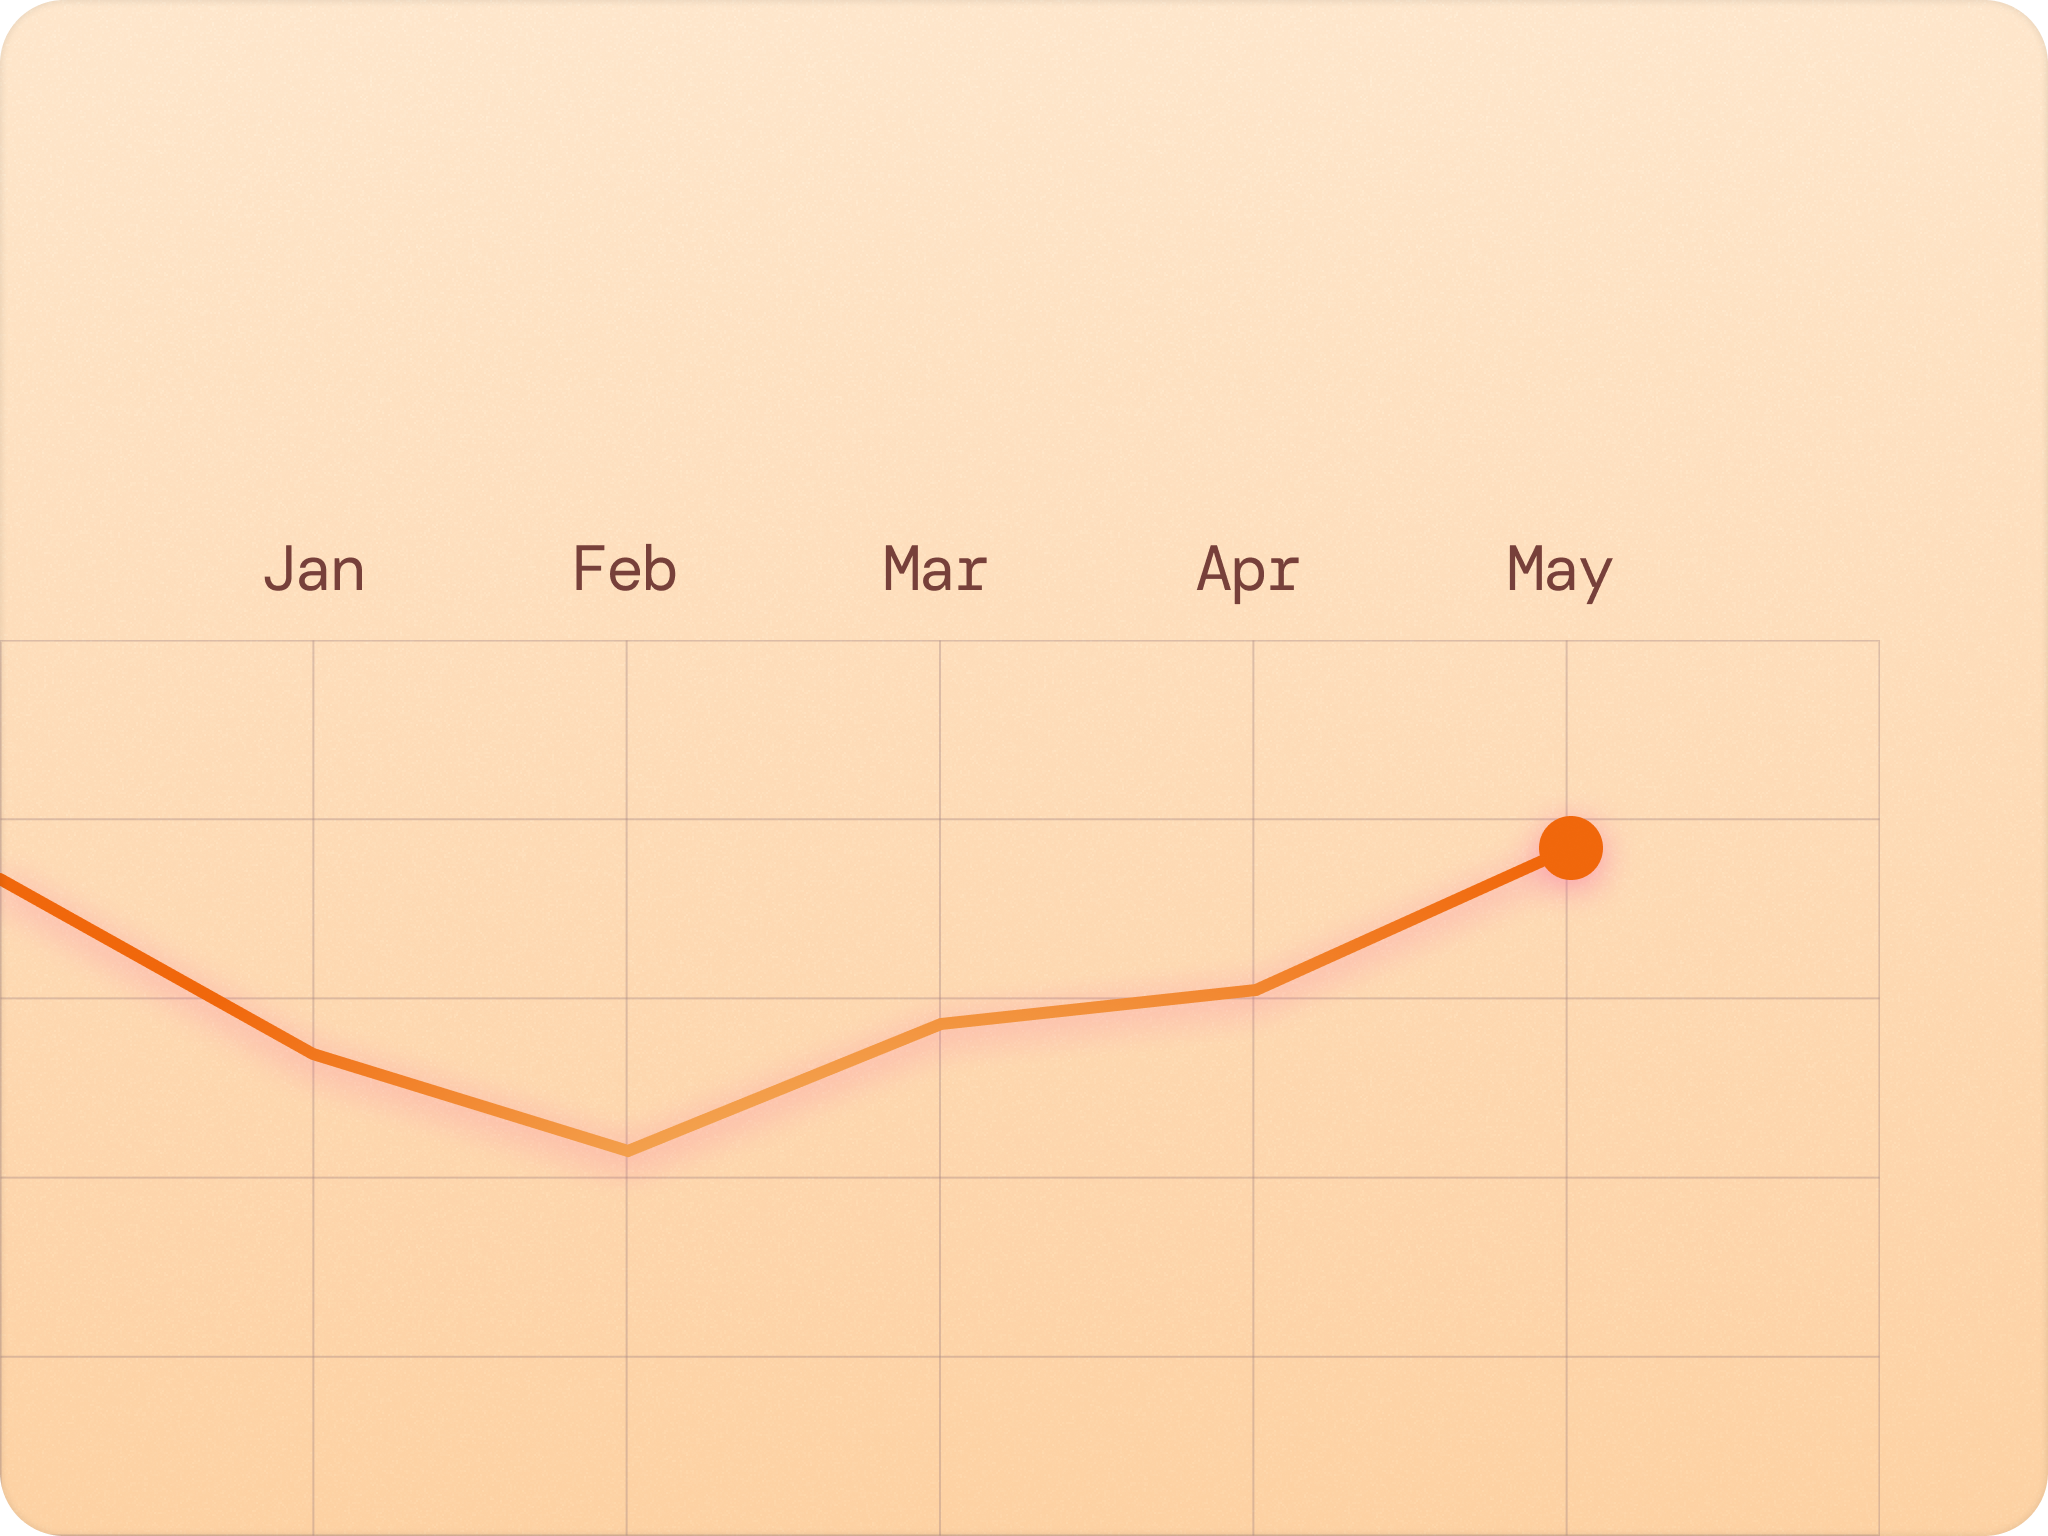
Track how specific engagement factors evolve across months
Zoios shows each well-being driver's score over time so you can see whether recognition, development or other factors are improving or declining across periods. The trend lines help you assess whether initiatives are working, like checking if your new performance-review process actually lifted development scores. By tracking individual drivers rather than a single overall score, you understand the components of your engagement story and can measure the impact of targeted interventions.
03
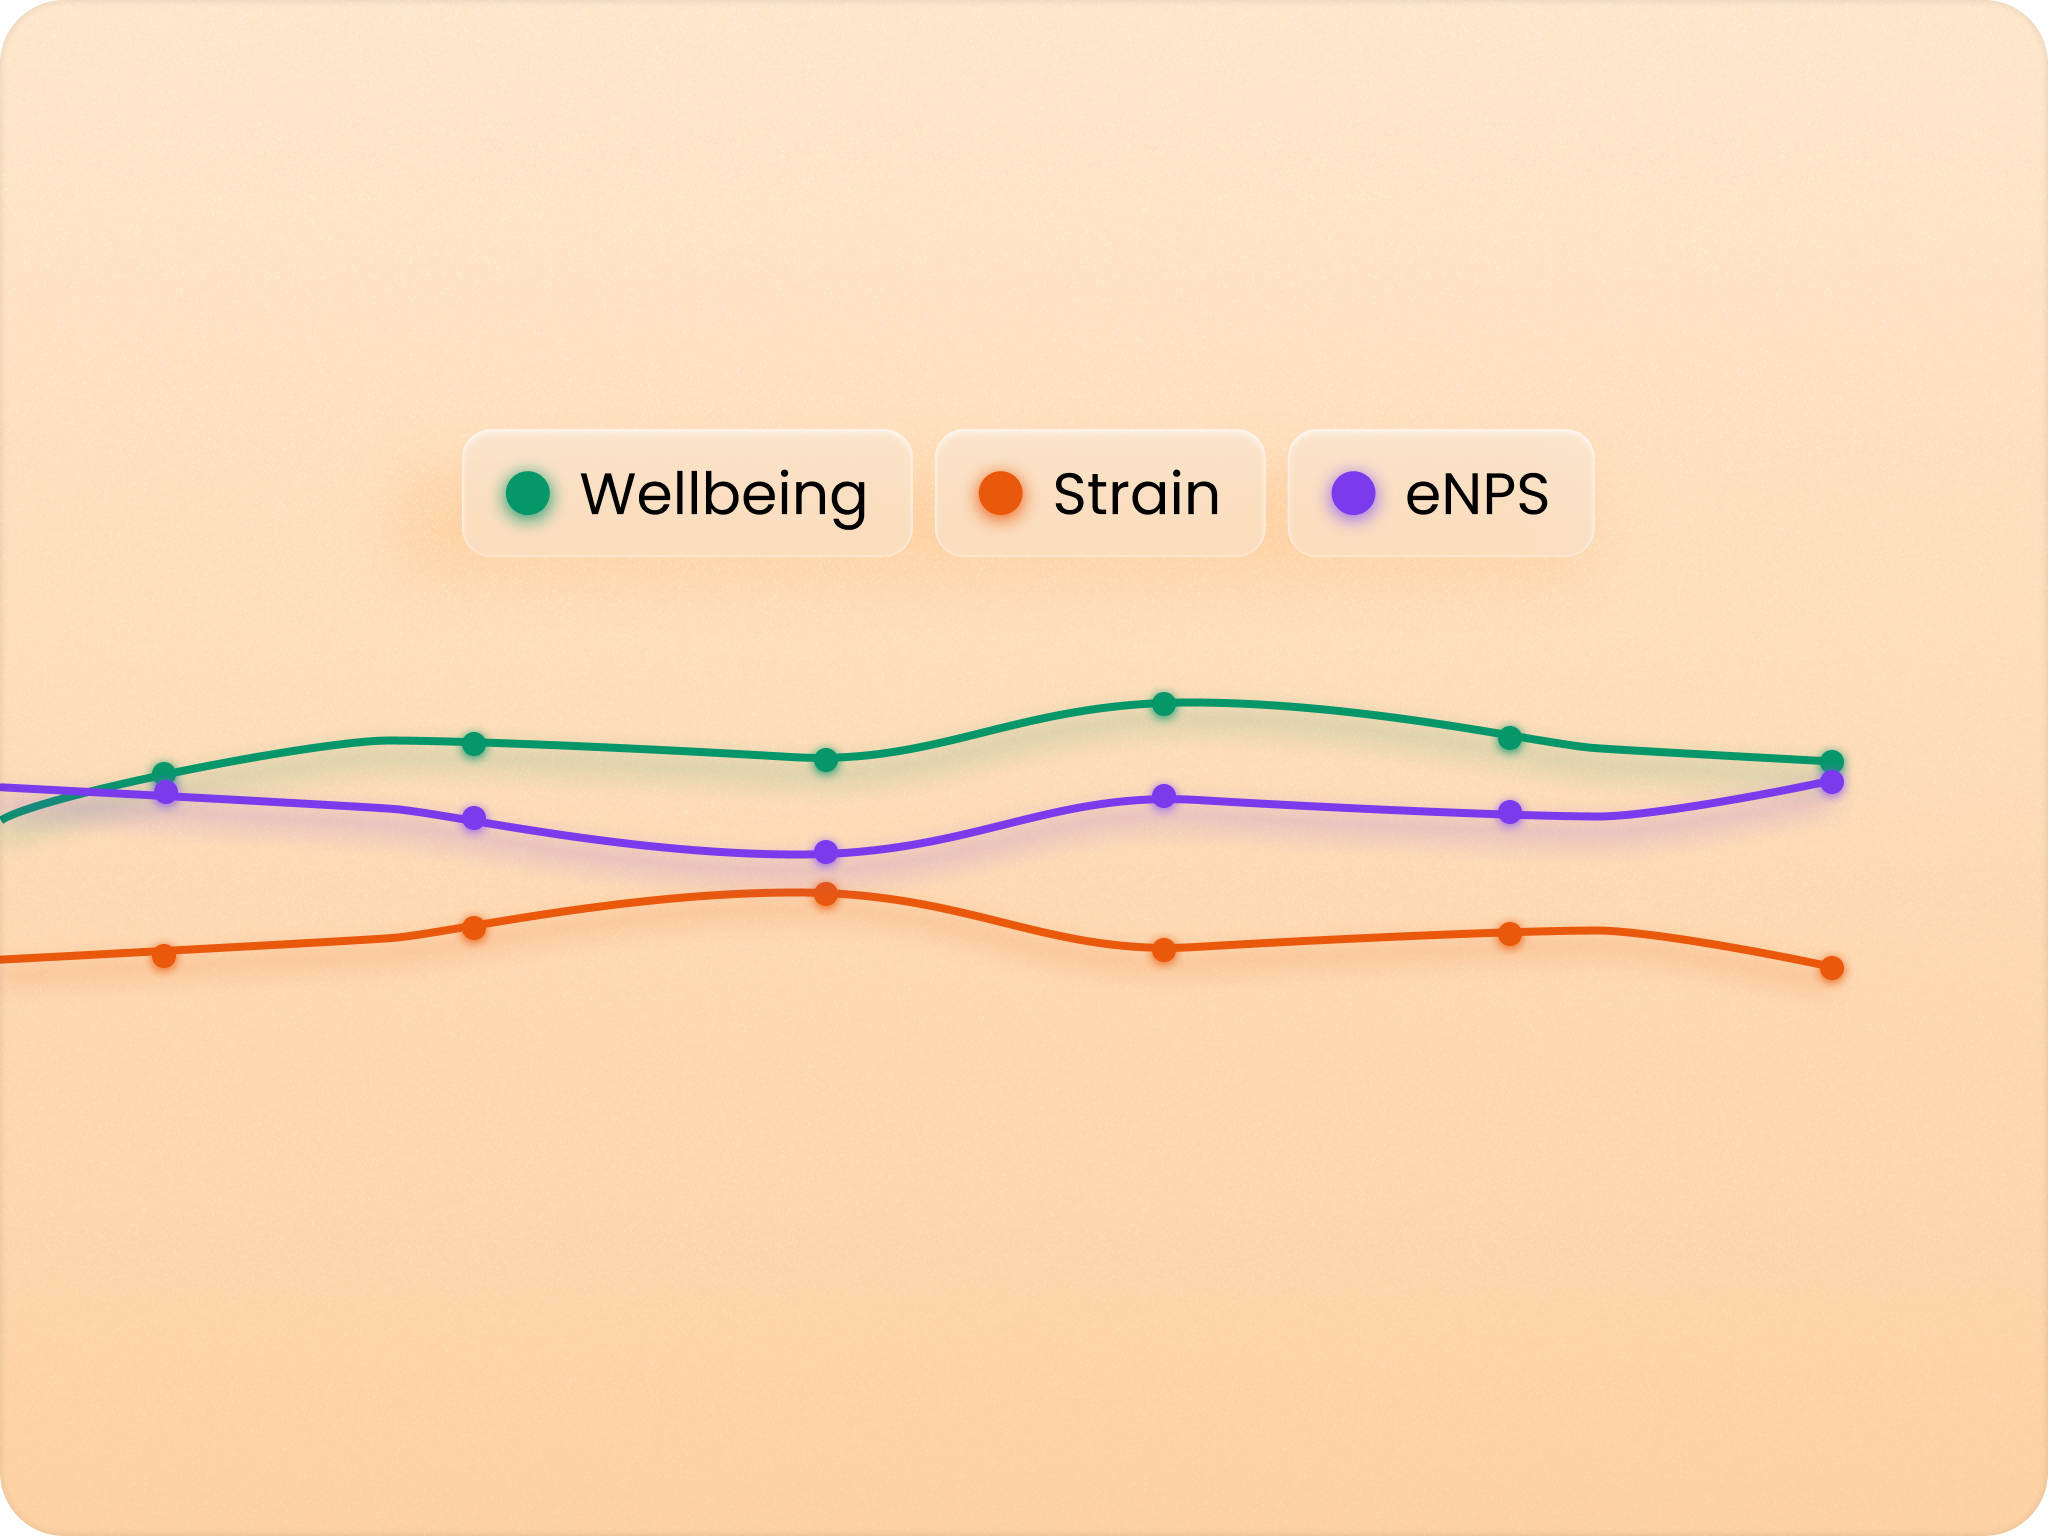
See company-wide engagement health at a glance
Zoios provides immediate organisational-level insight, showing overall well-being, strain and eNPS across the company the moment responses come in. The dashboard highlights your strongest and weakest drivers, response rate and a comparison with previous measurements, with no manual calculation. The instant company view helps executives and HR quickly assess organisational health and identify the biggest opportunities for cultural improvement.
04
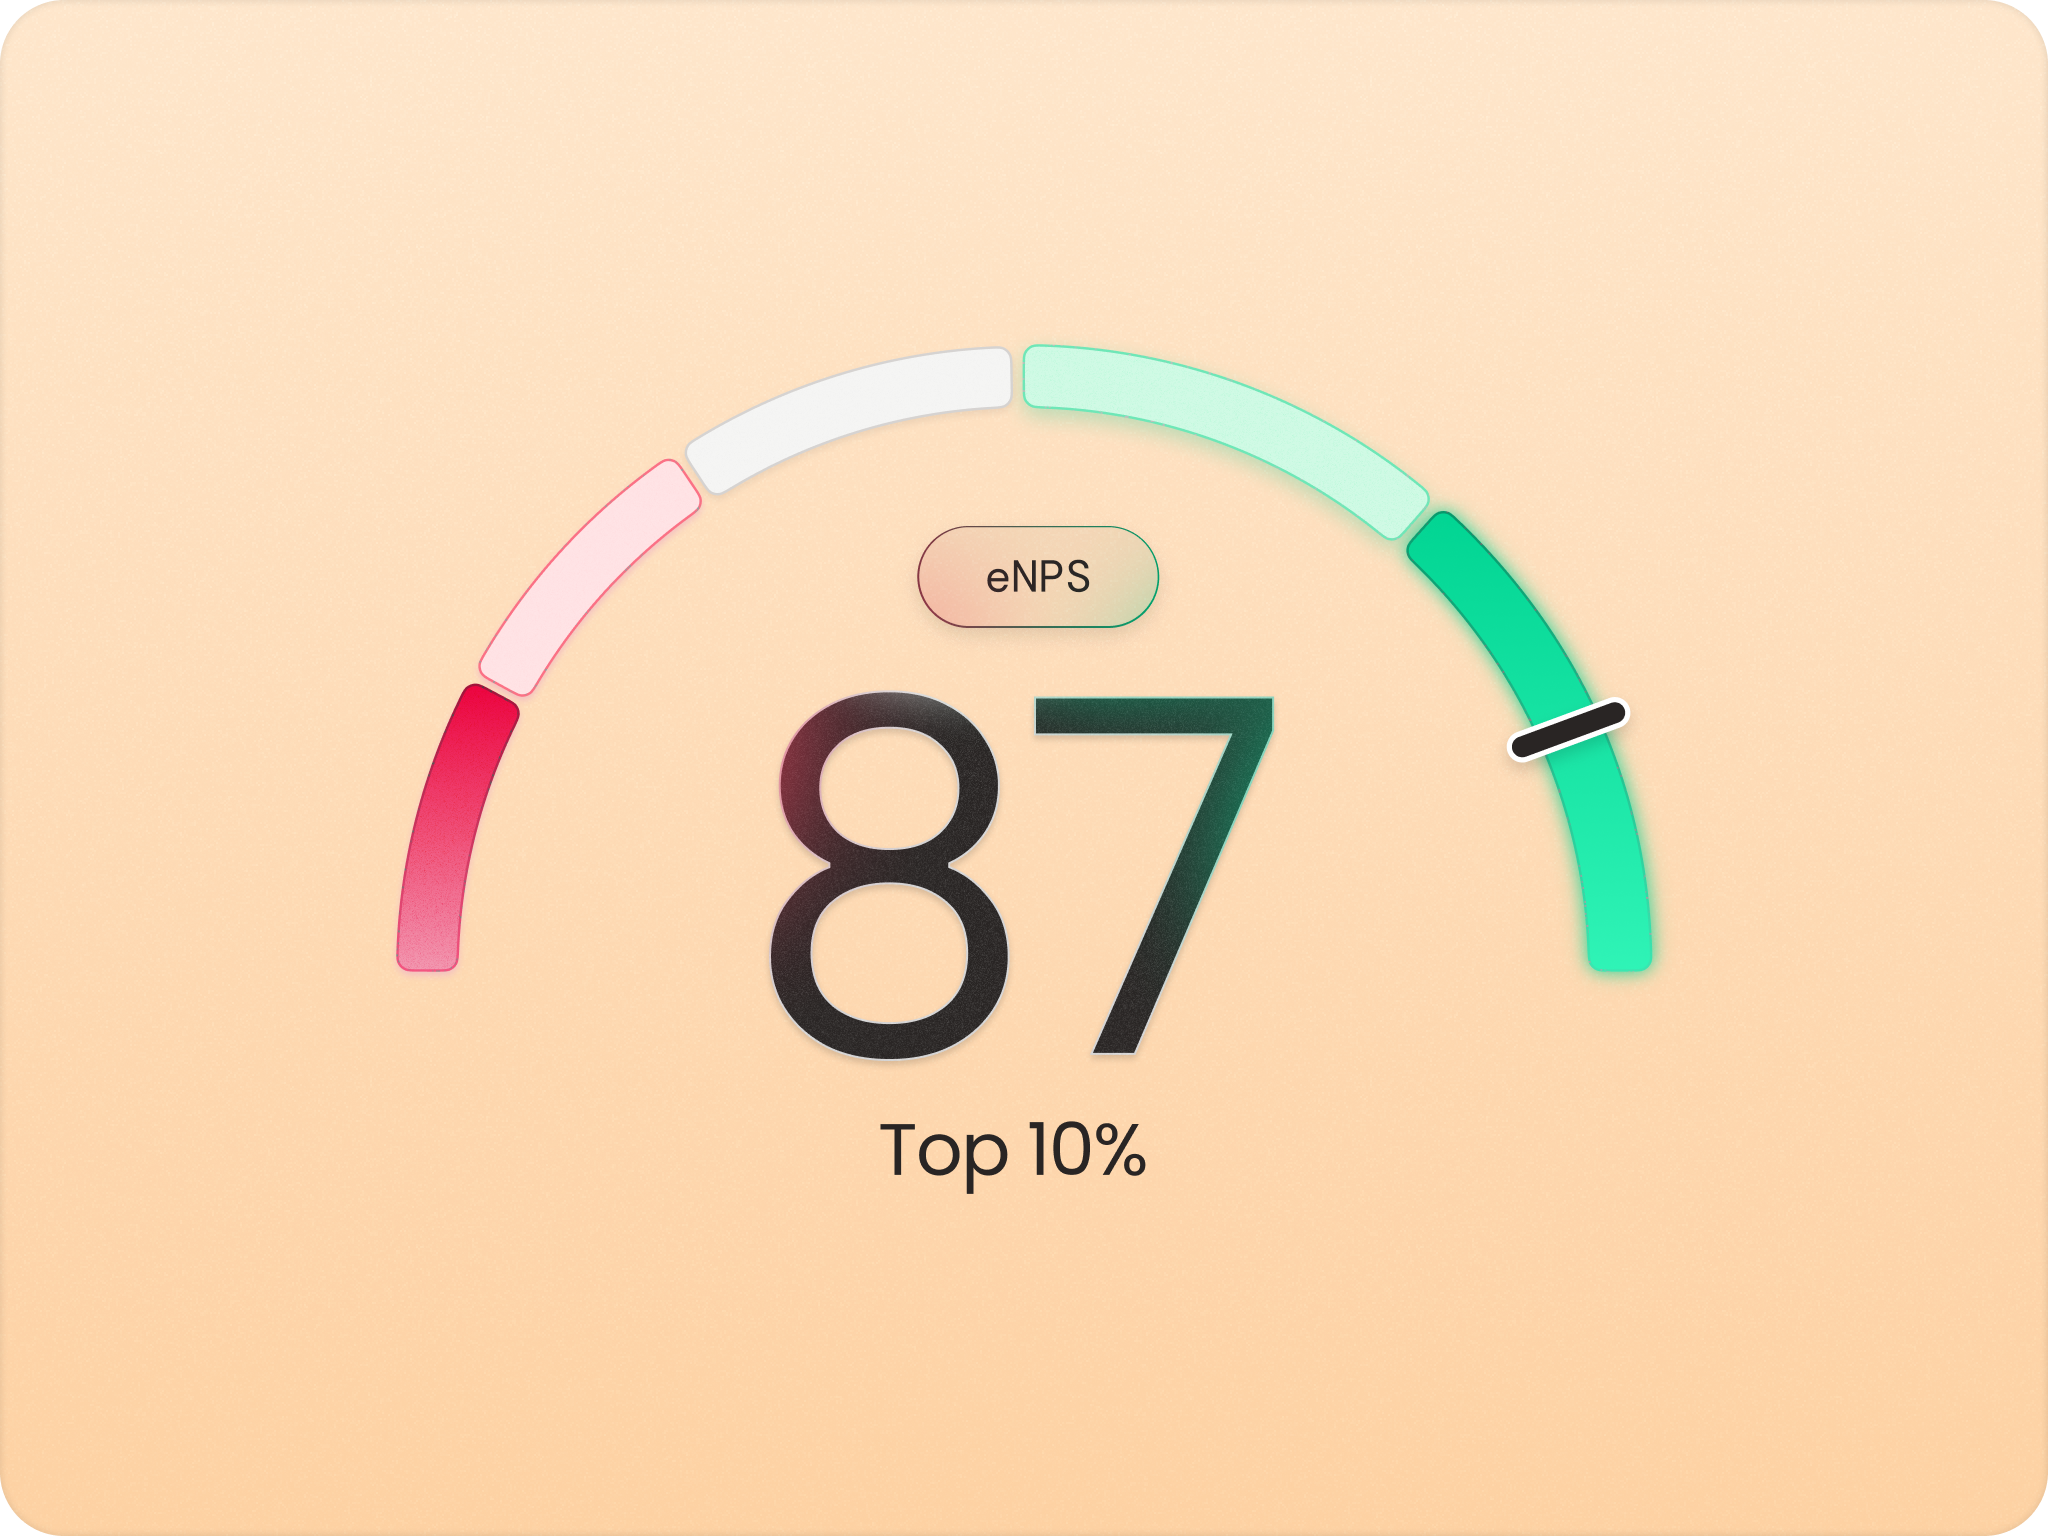
See how you stack up against your industry
Zoios provides industry benchmark data from thousands of companies so you can understand how your engagement compares to similar organisations. You see whether you rank in the top 10%, top 25% or below average for well-being and eNPS. External benchmarking adds perspective beyond internal comparison, helping you set realistic targets and understand whether your challenges are unique or industry-wide.
05
Get real-time engagement insights the moment surveys close
Zoios generates live dashboards and visualisations the instant employees complete the pulse survey, no waiting for manual analysis or report compilation. HR and managers see up-to-date well-being scores, trends and comments in real time without touching Excel or building presentations. Immediate access means you can respond to engagement issues quickly and make data-driven decisions without delay.
06
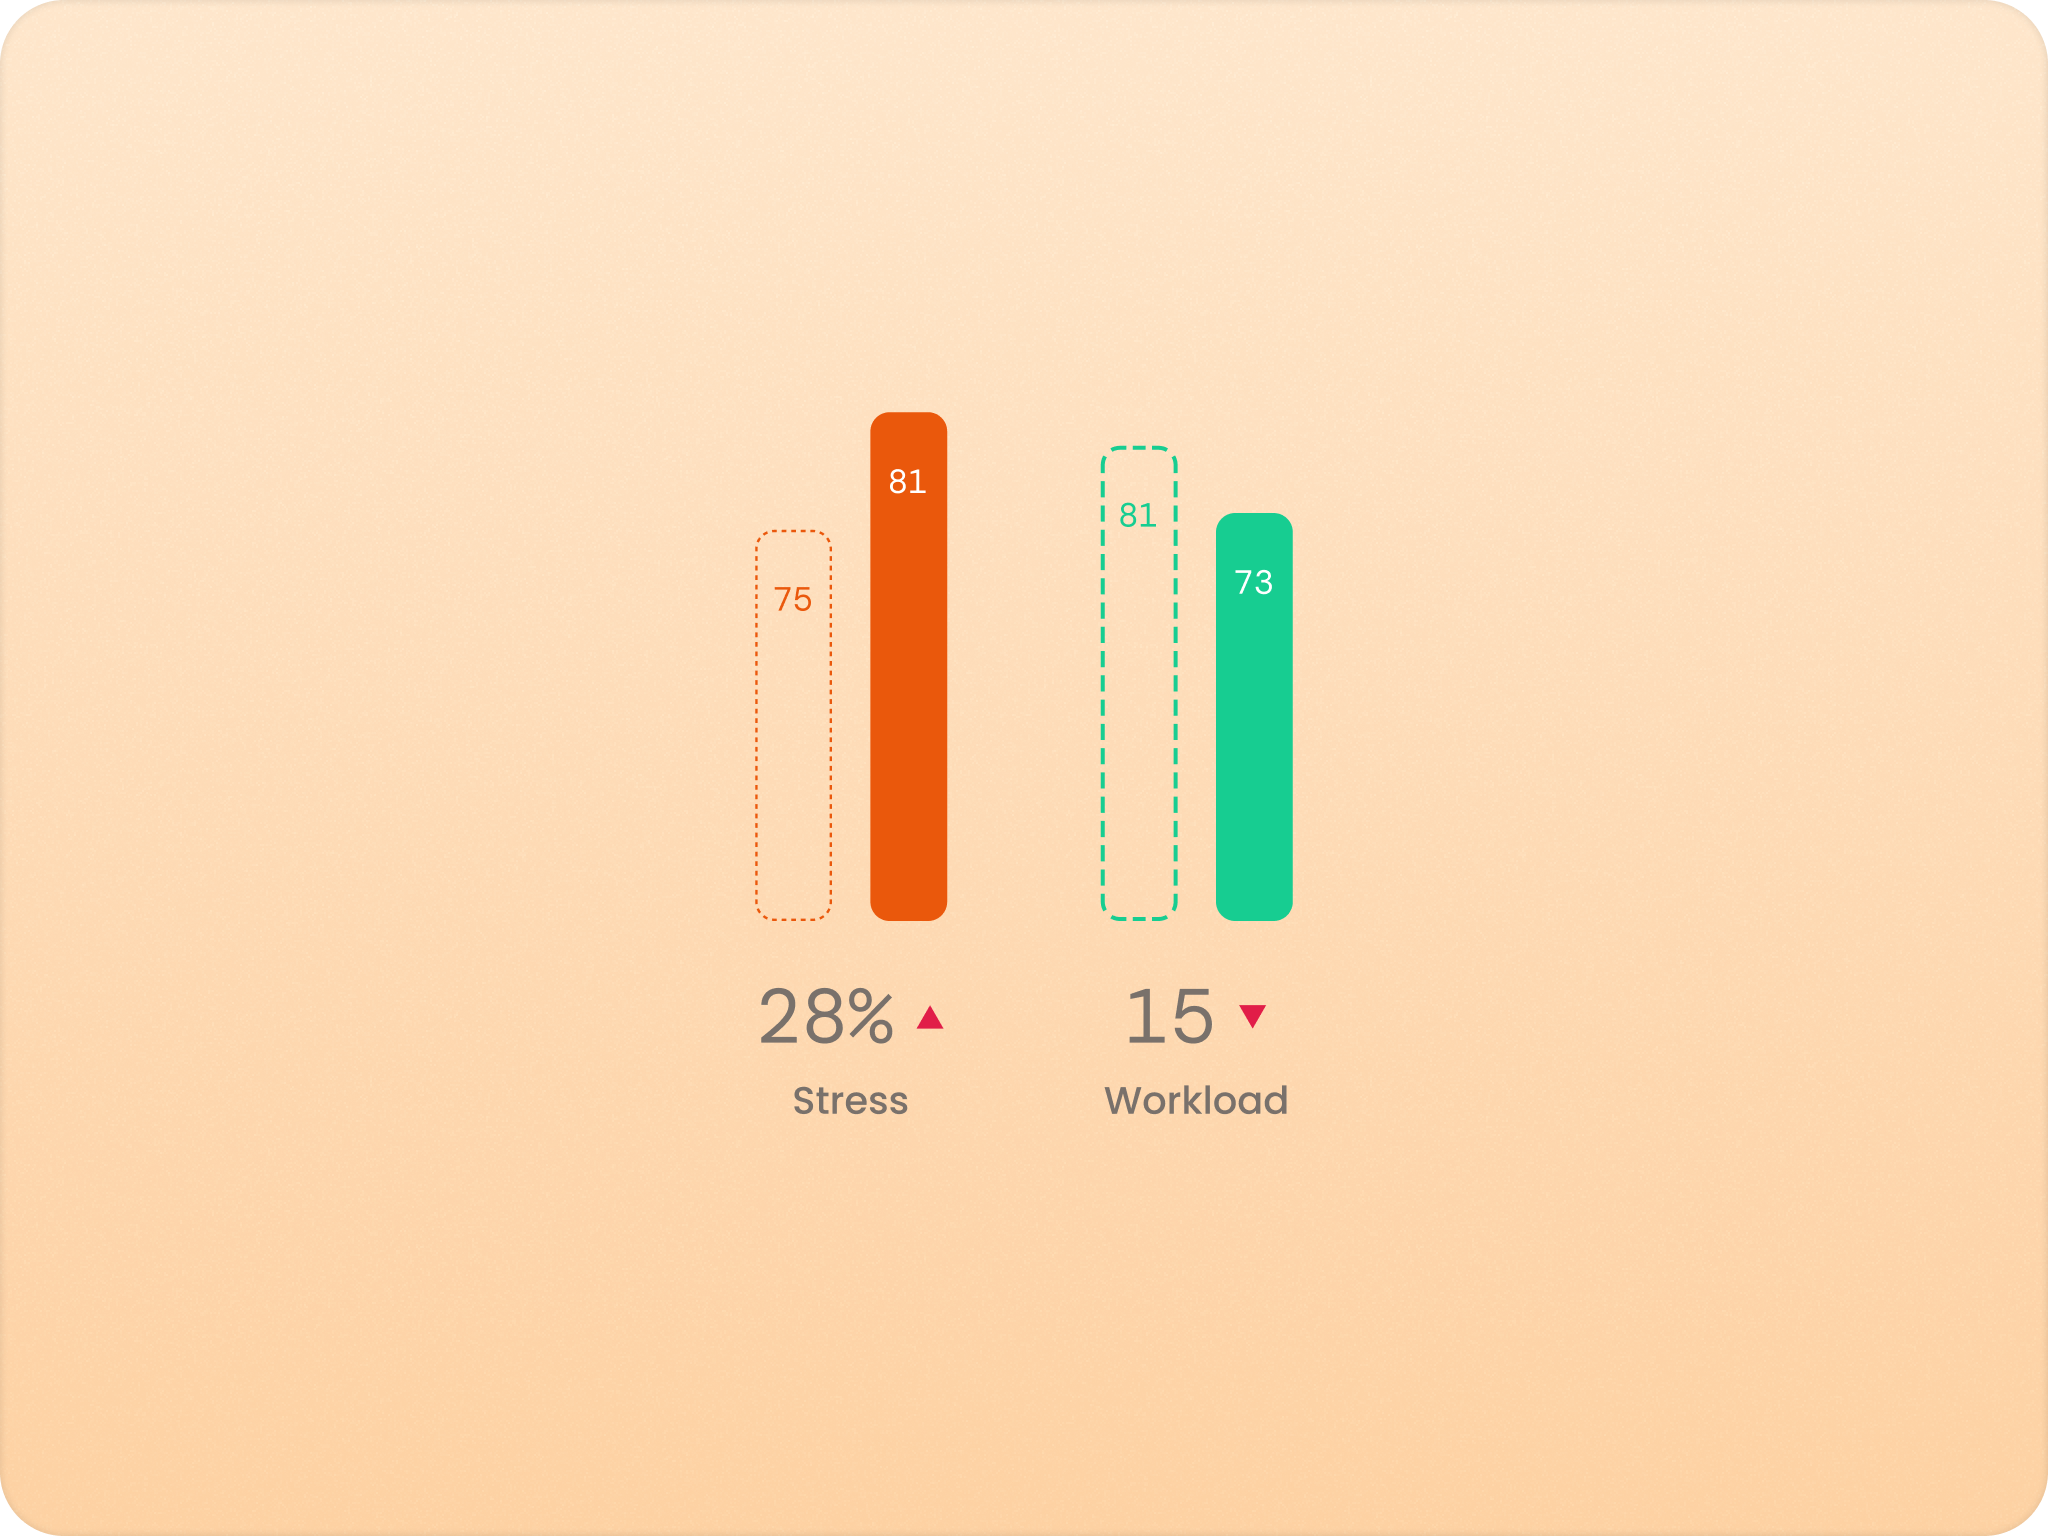
Understand whether stress comes from work volume or other factors
Zoios provides a workload-versus-strain chart that reveals whether team stress is driven by volume or by other complications like complexity, unclear expectations or personal issues. You see teams with high strain but low workload (pointing to non-volume issues) or high workload without strain (showing people are coping). The analysis prevents the common mistake of reducing workload when the real problem is poor collaboration or unclear priorities, and helps you target the right solution.
07
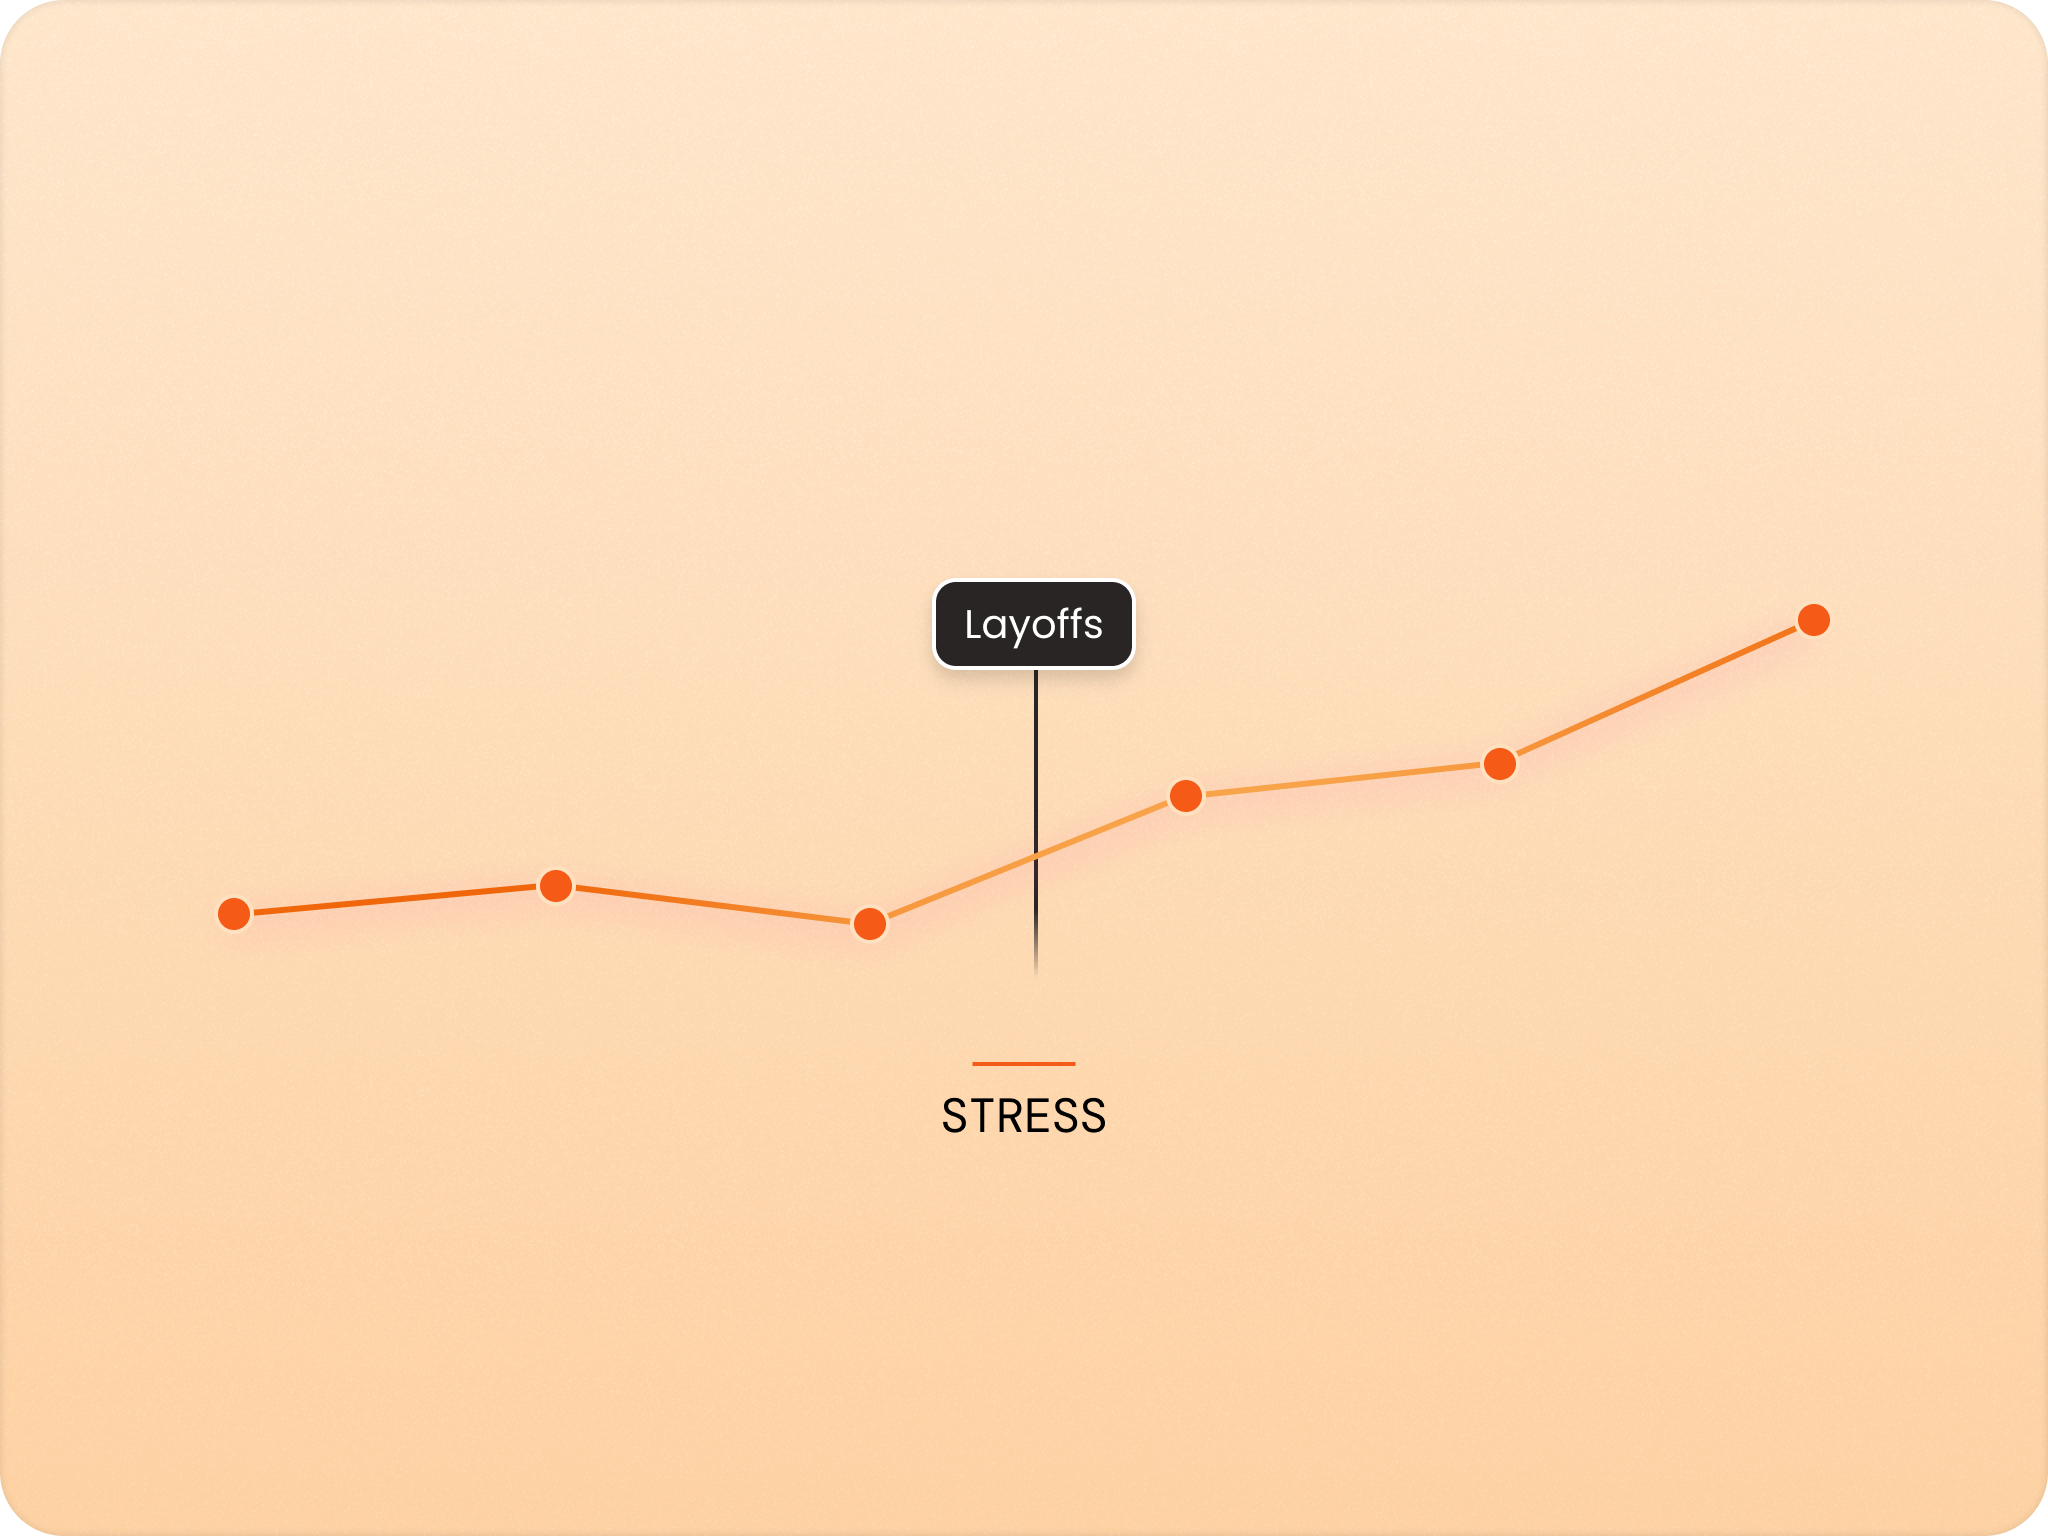
See exactly how your initiatives impact engagement over time
Zoios lets you log important events and initiatives (leadership changes, new benefits programmes, restructures and so on) and shows them as annotations on your engagement trend charts. When life harmony jumps 12 points in March, you know it coincided with your new flexible-work policy. When strain spikes in Q2, you can connect it to the major client project that started then. The visual link between actions and outcomes helps you understand what actually moves the needle.
Single data points tell you where you are today, but trends reveal where you are heading tomorrow. Without tracking engagement over time, you are flying blind on the questions that actually matter: Are things getting better or worse? Is that concerning score in Engineering a temporary blip or a deteriorating pattern? Did your new recognition programme actually improve anything, or did you waste time and budget on an initiative that changed nothing?
Zoios tracks every well-being driver, strain level and eNPS score across multiple survey periods so you can see whether scores are improving, declining or holding steady. Visual trend lines make it instantly clear which teams are on an upward trajectory and which are sliding downward. You spot the Engineering team's well-being dropping three months in a row before it becomes a retention crisis, or notice that your Sales team's recognition scores have climbed 15 points since implementing peer shoutouts.
This historical view transforms engagement measurement from snapshots into stories. You can finally answer whether your culture initiatives are working or wasting resources. You catch problems early when they are still fixable, intervening when scores start dropping instead of waiting until you have mass resignations. Most importantly, you move from reactive firefighting to proactive management, addressing engagement issues before they become expensive organisational problems that damage morale and drive your best people out the door.
Want to see it in action?
Set up your first measurement in minutes.
Zoios is free to get going. Try it with your team or talk to a human first, your call.